

Question: The following table gives current prices (N$) and quantities produced over ten years for the Namibian economy which produces only food, meat, fish and milk
The following table gives current prices (N$) and quantities produced over ten years
for the Namibian economy which produces only food, meat, fish and milk respectively.
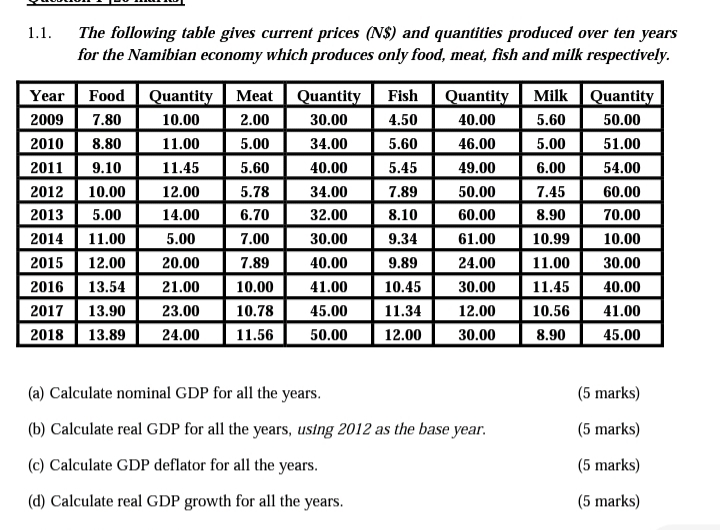
1.1. The following table gives current prices (N$) and quantities produced over ten years for the Namibian economy which produces only food, meat, fish and milk respectively. Year Food Quantity Meat Quantity Fish Quantity Milk Quantity 2009 7.80 10.00 2.00 30.00 4.50 40.00 5.60 50.00 2010 8.80 11.00 5.00 34.00 5.60 46.00 5.00 51.00 2011 9.10 11.45 5.60 40.00 5.45 49.00 6.00 54.00 2012 10.00 12.00 5.78 34.00 7.89 50.00 7.45 60.00 2013 5.00 14.00 6.70 32.00 8.10 60.00 8.90 70.00 2014 11.00 5.00 7.00 30.00 9.34 61.00 10.99 10.00 2015 12.00 20.00 7.89 40.00 9.89 24.00 11.00 30.00 2016 13.54 21.00 10.00 41.00 10.45 30.00 11.45 40.00 2017 13.90 23.00 10.78 45.00 11.34 12.00 10.56 41.00 2018 13.89 24.00 11.56 50.00 12.00 30.00 8.90 45.00 (a) Calculate nominal GDP for all the years. (5 marks) (b) Calculate real GDP for all the years, using 2012 as the base year. (5 marks) (c) Calculate GDP deflator for all the years. (5 marks) (d) Calculate real GDP growth for all the years.
Step by Step Solution
There are 3 Steps involved in it

Get step-by-step solutions from verified subject matter experts