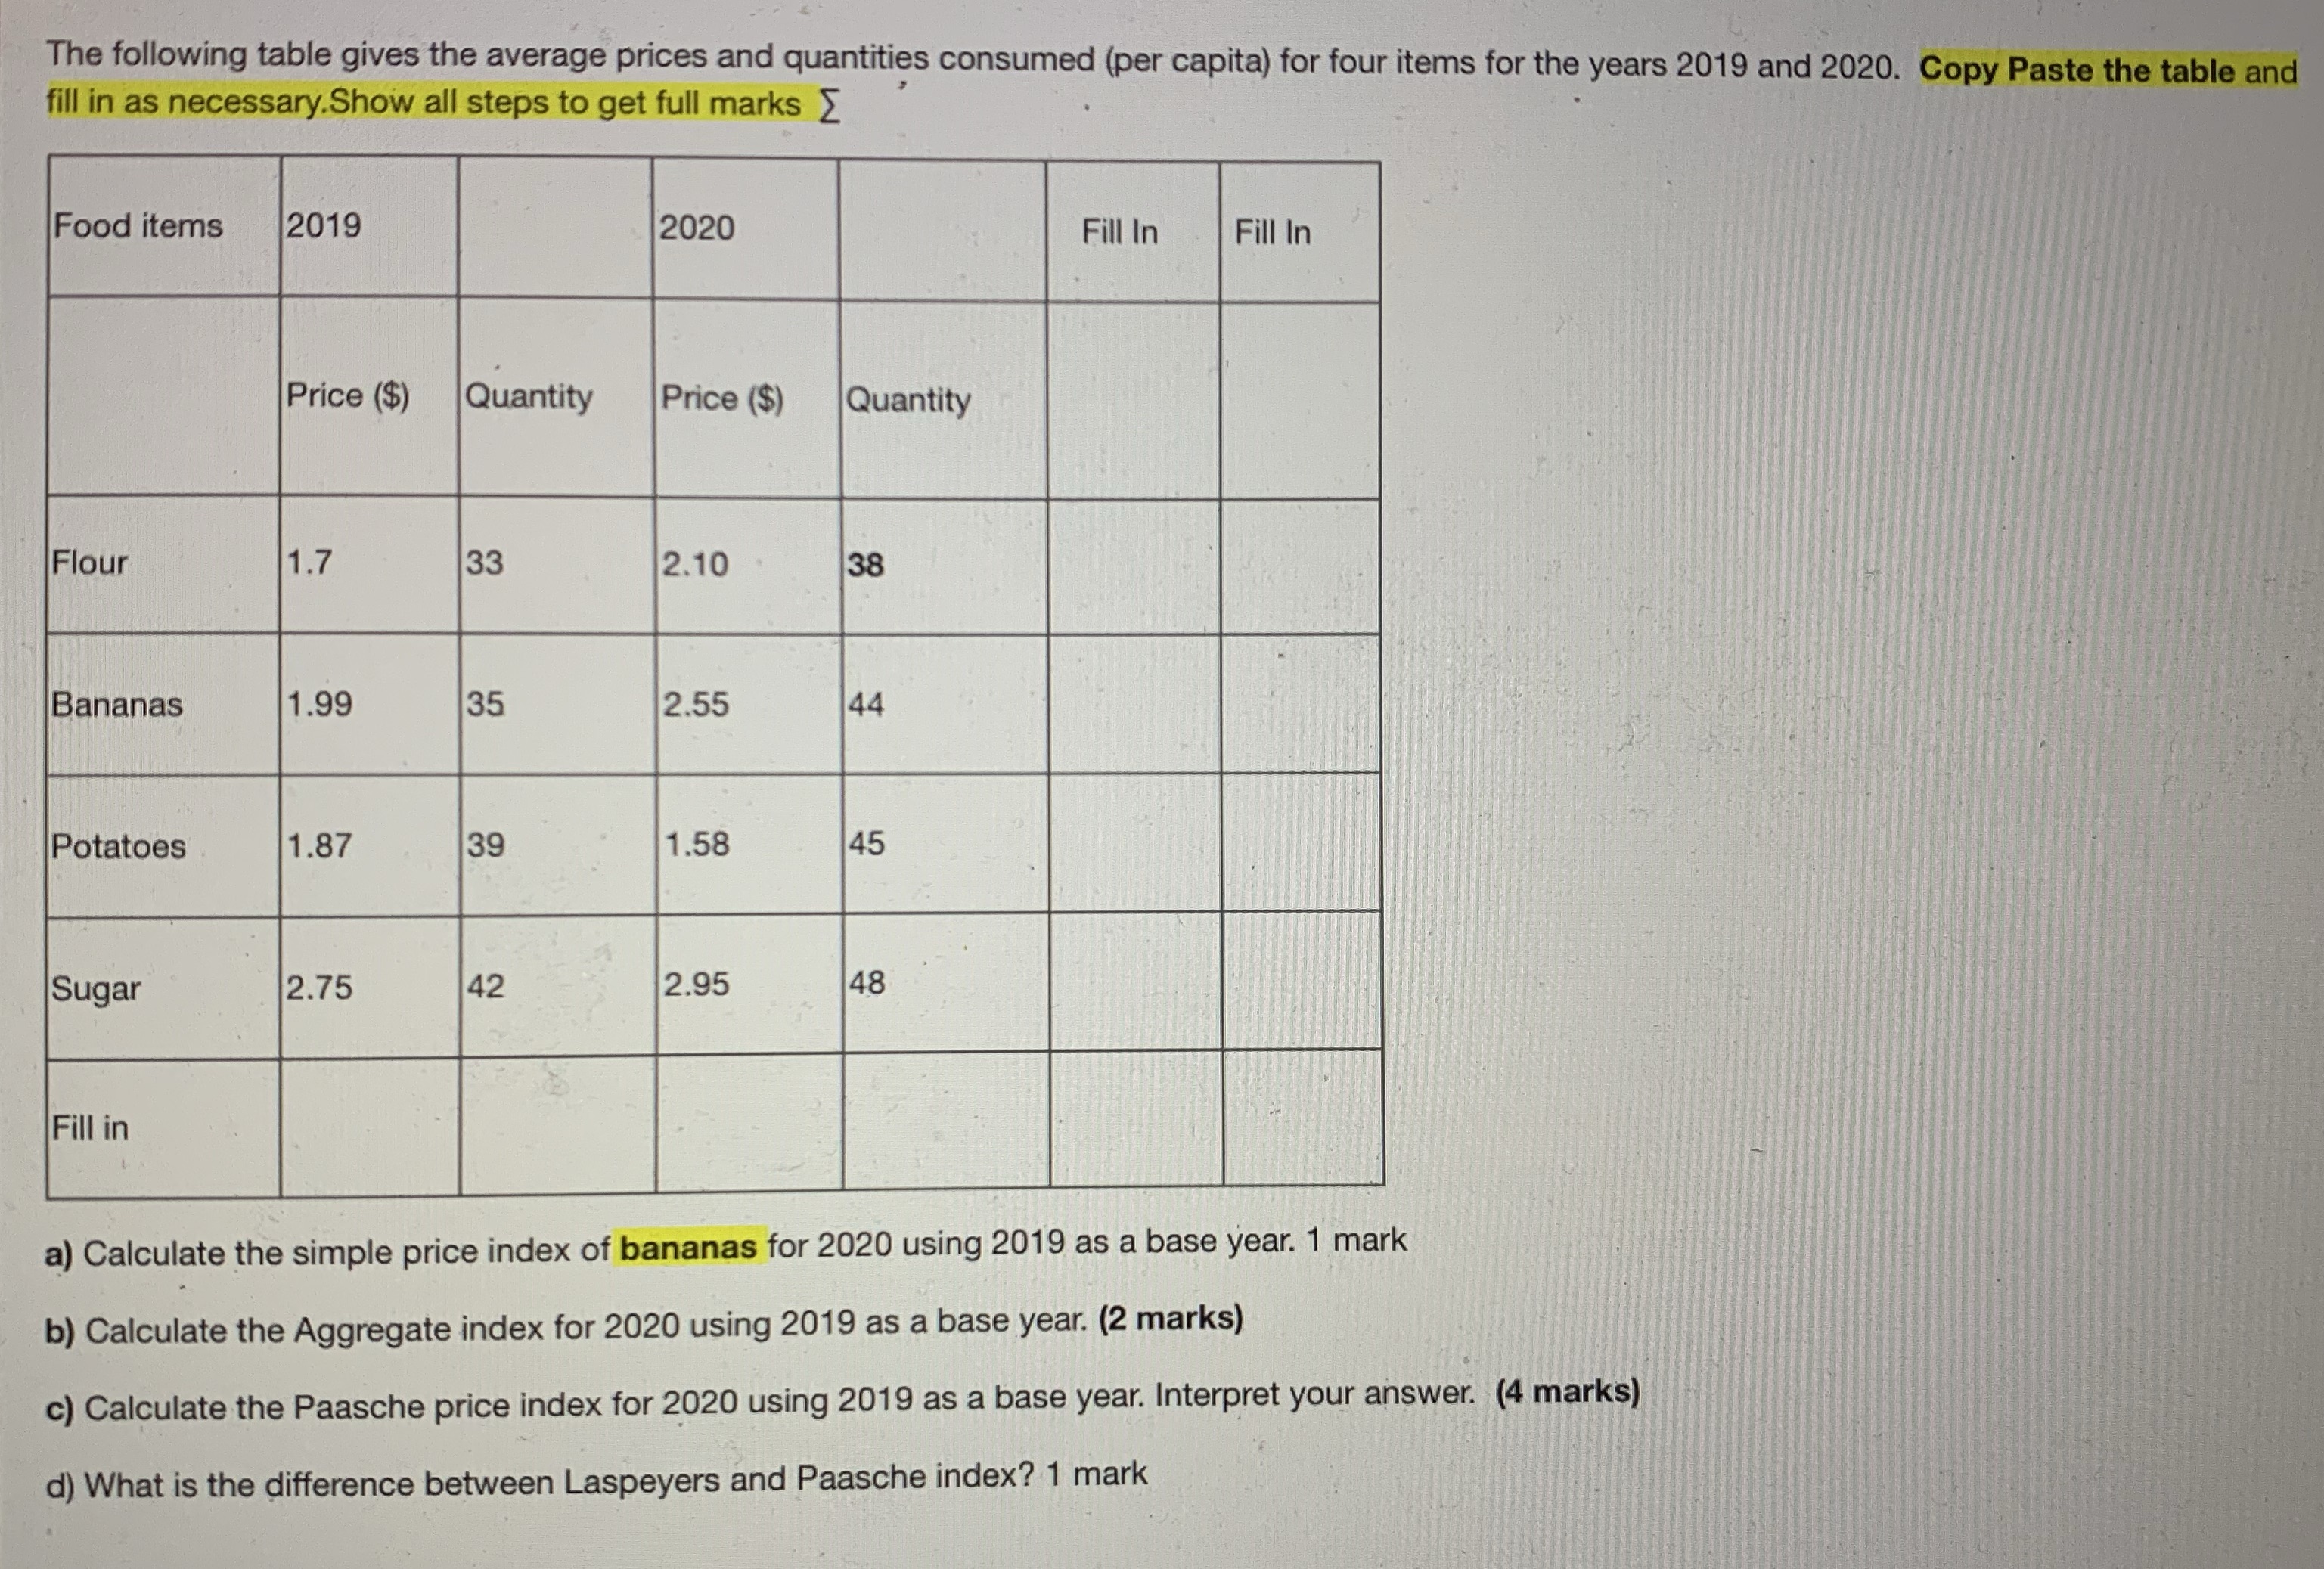
Question: The following table gives the average prices and quantities consumed (per capita) for four items for the years 2019 and 2020. Copy Paste the table

The following table gives the average prices and
The following table gives the average prices and quantities consumed (per capita) for four items for the years 2019 and 2020. Copy Paste the table and fill in as necessary.Show all steps to get full marks [ Food items 2019 2020 Fill In Fill In Price ($) Quantity Price ($) Quantity Flour 1.7 33 2.10 38 Bananas 1.99 35 2.55 44 Potatoes 1.87 39 1.58 45 Sugar 2.75 42 2.95 48 Fill in a) Calculate the simple price index of bananas for 2020 using 2019 as a base year. 1 mark b) Calculate the Aggregate index for 2020 using 2019 as a base year. (2 marks) c) Calculate the Paasche price index for 2020 using 2019 as a base year. Interpret your answer. (4 marks) d) What is the difference between Laspeyers and Paasche index? 1 mark

Step by Step Solution

There are 3 Steps involved in it

1 Expert Approved Answer
Step: 1 Unlock blur-text-image
Question Has Been Solved by an Expert!

Get step-by-step solutions from verified subject matter experts

Step: 2 Unlock
Step: 3 Unlock

Students Have Also Explored These Related Accounting Questions!