

Question: The following table is a sample that shows the response to the Survey question How long is your oneway commute from home to school (in
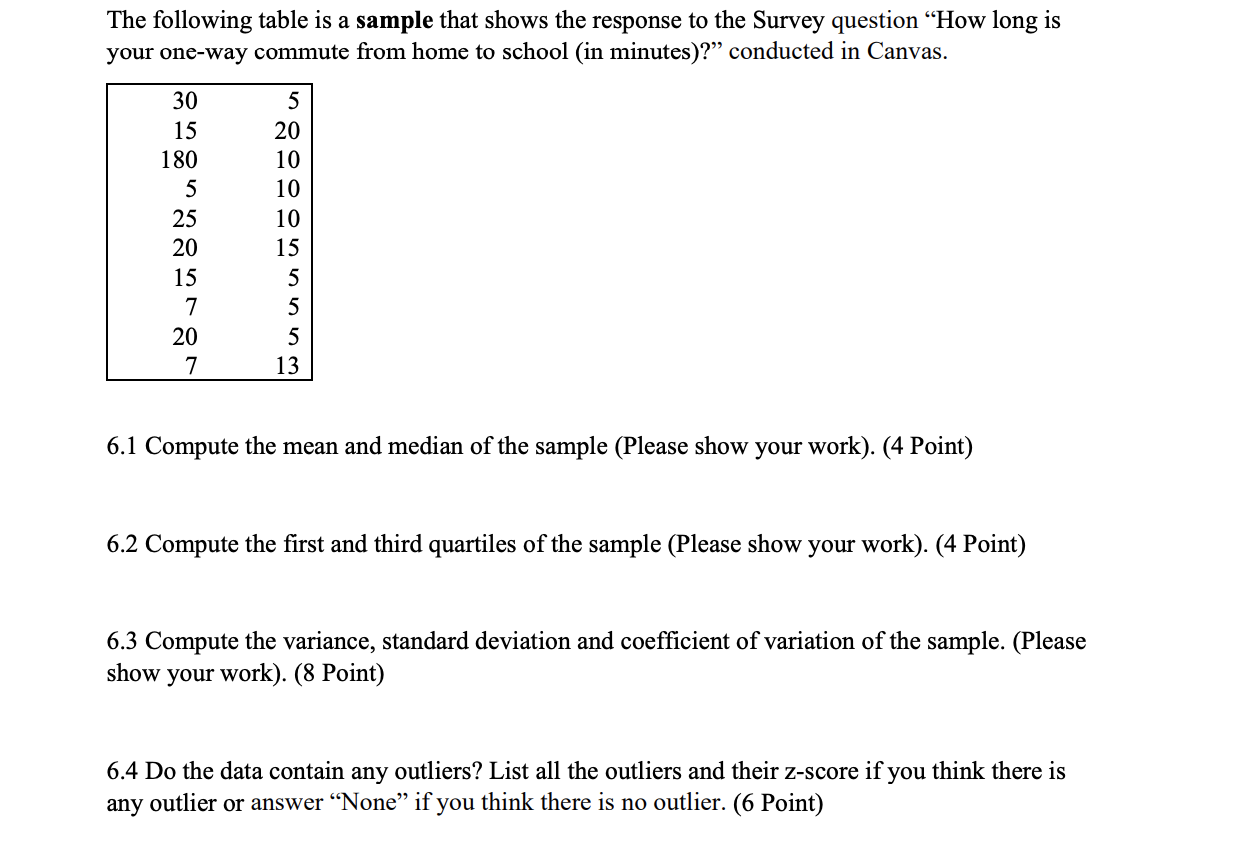
The following table is a sample that shows the response to the Survey question \"How long is your oneway commute from home to school (in minutes)?\" conducted in Canvas. 6.1 Compute the mean and median of the sample (Please show your work). (4 Point) 6.2 Compute the rst and third quartiles of the sample (Please show your work). (4 Point) 6.3 Compute the variance, standard deviation and coefcient of variation of the sample. (Please show your work). (8 Point) 6.4 Do the data contain any outliers? List all the outliers and their zscore if you think there is any outlier or answer \"None\" if you think there is no outlier. (6 Point)
Step by Step Solution
There are 3 Steps involved in it

Get step-by-step solutions from verified subject matter experts