

Question: The following table is the frequency distribution for the amount 'screen time' (in hours) had each day by 50 employees at a large, multinational
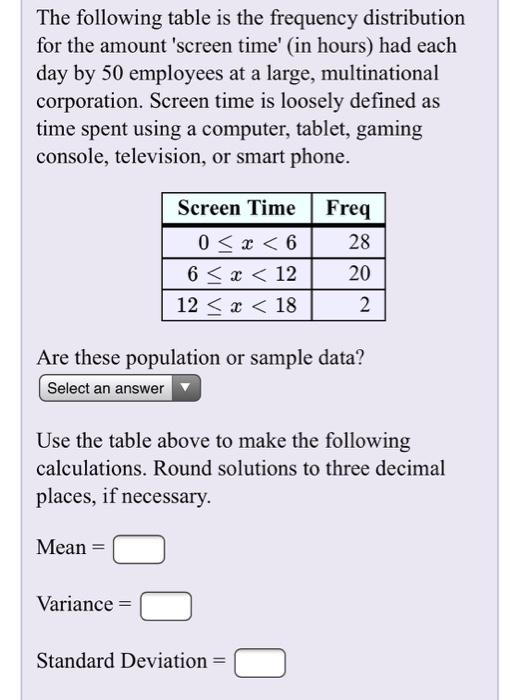
The following table is the frequency distribution for the amount 'screen time' (in hours) had each day by 50 employees at a large, multinational corporation. Screen time is loosely defined as time spent using a computer, tablet, gaming console, television, or smart phone. Screen Time Freq 0 < x
Step by Step Solution
There are 3 Steps involved in it
1 Expert Approved Answer
Step: 1 Unlock

Question Has Been Solved by an Expert!
Get step-by-step solutions from verified subject matter experts
Step: 2 Unlock
Step: 3 Unlock