

Question: The following table presents the data for Caoba Inc. as of December 31, 2018: Accounts payable Accounts receivable Cash and cash equivalents COGS Common stock
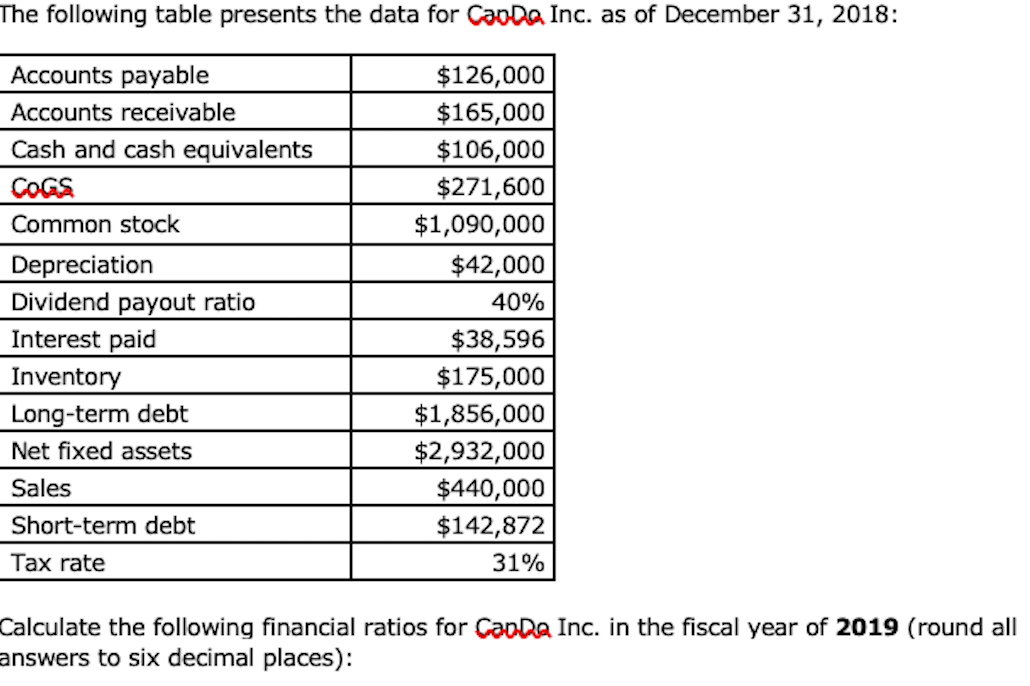
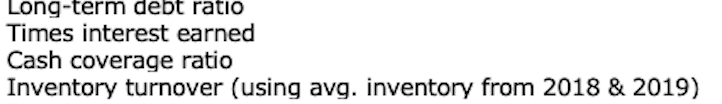
The following table presents the data for Caoba Inc. as of December 31, 2018: Accounts payable Accounts receivable Cash and cash equivalents COGS Common stock Depreciation Dividend payout ratio Interest paid Inventory Long-term debt Net fixed assets Sales Short-term debt Tax rate $126,000 $165,000 $106,000 $271,600 $1,090,000 $42,000 40% $38,596 $175,000 $1,856,000 $2,932,000 $440,000 $142,872 31% Calculate the following financial ratios for CanDa Inc. in the fiscal year of 2019 (round all answers to six decimal places): Long-term debt ratio Times interest earned Cash coverage ratio Inventory turnover (using avg. inventory from 2018 & 2019)
Step by Step Solution
There are 3 Steps involved in it
1 Expert Approved Answer
Step: 1 Unlock

Question Has Been Solved by an Expert!
Get step-by-step solutions from verified subject matter experts
Step: 2 Unlock
Step: 3 Unlock