

Question: The following table provides information on expected return (E(rp)) and standard deviation (Op) for four portfolios: Portfolio P Q R S Ero) 8.80% 8.53% 9.13%
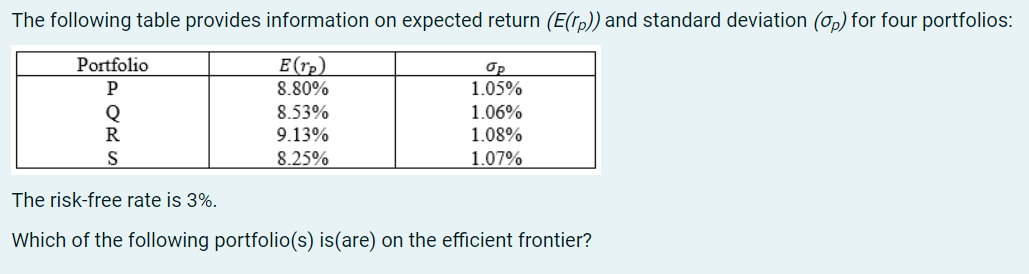
The following table provides information on expected return (E(rp)) and standard deviation (Op) for four portfolios: Portfolio P Q R S Ero) 8.80% 8.53% 9.13% 8.25% Op 1.05% 1.06% 1.08% 1.07% The risk-free rate is 3%. Which of the following portfolio(s) is(are) on the efficient frontier
Step by Step Solution
There are 3 Steps involved in it
1 Expert Approved Answer
Step: 1 Unlock

Question Has Been Solved by an Expert!
Get step-by-step solutions from verified subject matter experts
Step: 2 Unlock
Step: 3 Unlock