

Question: The following table provides summary data for Applied Materials Inc. and its competitors, KLA Tencor Corporation and Lam Research Corporation. (in millions) Applied Materials KLA
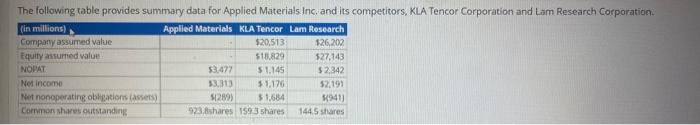
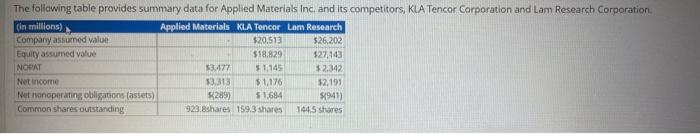
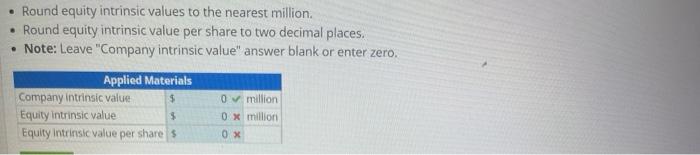
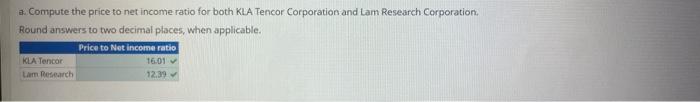
The following table provides summary data for Applied Materials Inc. and its competitors, KLA Tencor Corporation and Lam Research Corporation. (in millions) Applied Materials KLA Tencor Lam Research Company assumed value $20,513 126,202 Equity assumed value $18.829 527,143 NOPAT 53.477 51.145 $ 2.342 Net income 33.313 $1,176 52,191 Net nonoperating obligations assets) 51289) 51.684 1941) Corrinon shares outstanding 923.8shares 1593 shares 1445 shares The following table provides summary data for Applied Materials Inc and its competitors, KLA Tencor Corporation and Lam Research Corporation (in millions) Applied Materials KLA Tencor Lam Research Company assumed value $20.513 $26,202 Equity assumed value $18.829 $27,143 NOPAT 3.177 $1,145 $2,342 Net income $3,313 $1,176 12,191 Methanoperating obligations (assets) 3289) 51,684 $1941 Common shares outstanding 923.8shares 159.3 Shares 144.5 shares Round equity intrinsic values to the nearest million. Round equity intrinsic value per share to two decimal places. Note: Leave "Company intrinsic value" answer blank or enter zero. Applied Materials Company intrinsic value $ Equity intrinsic value $ Equity intrinsic value per shares 0 million 0.x million 0 X a. Compute the price to net income ratio for both KLA Tencor Corporation and Lam Research Corporation. Round answers to two decimal places, when applicable. KLA Tencor Lam Research Price to Net Income ratio 16.01 12.39
Step by Step Solution
There are 3 Steps involved in it

Get step-by-step solutions from verified subject matter experts