

Question: The following table represents a plan for a project: a) What is the critical path of this project? b) What is the expected completion time
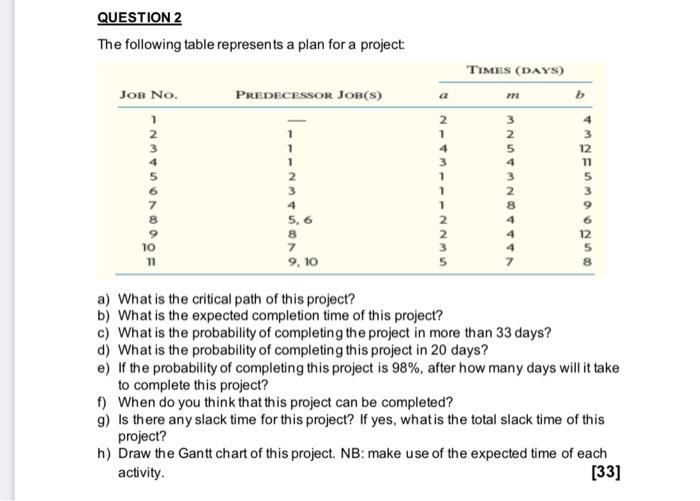
The following table represents a plan for a project: a) What is the critical path of this project? b) What is the expected completion time of this project? c) What is the probability of completing the project in more than 33 days? d) What is the probability of completing this project in 20 days? e) If the probability of completing this project is 98%, after how many days will it take to complete this project? f) When do you think that this project can be completed? g) Is there any slack time for this project? If yes, what is the total slack time of this project? h) Draw the Gantt chart of this project. NB: make use of the expected time of each activity. [33]
Step by Step Solution
There are 3 Steps involved in it

Get step-by-step solutions from verified subject matter experts