

Question: The following table represents the five number summary for a given data. From the table the range of the middle $50 %$ of the data
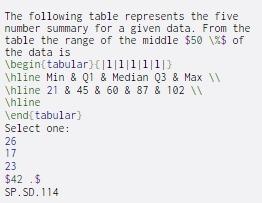
The following table represents the five number summary for a given data. From the table the range of the middle $50 %$ of the data is \begin{tabular) 111111113 \hline Min & Q1 & Median Q3 & Max \hline 21 & 45 & 60 & 87 & 102 \hline \end{tabular Select one: 26 17 23 $42.$ SP.SD. 114
Step by Step Solution
There are 3 Steps involved in it
1 Expert Approved Answer
Step: 1 Unlock

Question Has Been Solved by an Expert!
Get step-by-step solutions from verified subject matter experts
Step: 2 Unlock
Step: 3 Unlock