

Question: The following table represents the observed elevations for the Benchmark A and three turning points in a closed level loop, determine the adjusted elevations
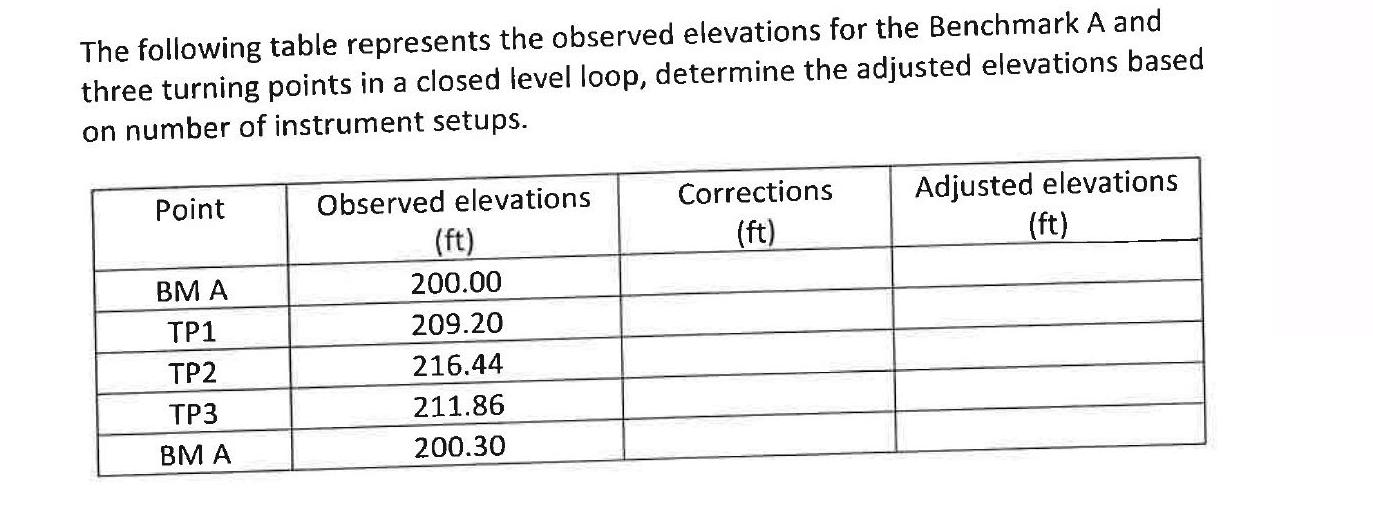
The following table represents the observed elevations for the Benchmark A and three turning points in a closed level loop, determine the adjusted elevations based on number of instrument setups. Point BM A TP1 TP2 TP3 BM A Observed elevations (ft) 200.00 209.20 216.44 211.86 200.30 Corrections (ft) Adjusted elevations (ft)
Step by Step Solution
★★★★★
3.19 Rating (144 Votes )
There are 3 Steps involved in it
1 Expert Approved Answer
Step: 1 Unlock

Answer BMA 200 TPI 209 TP2 ... View full answer
Question Has Been Solved by an Expert!
Get step-by-step solutions from verified subject matter experts
Step: 2 Unlock
Step: 3 Unlock