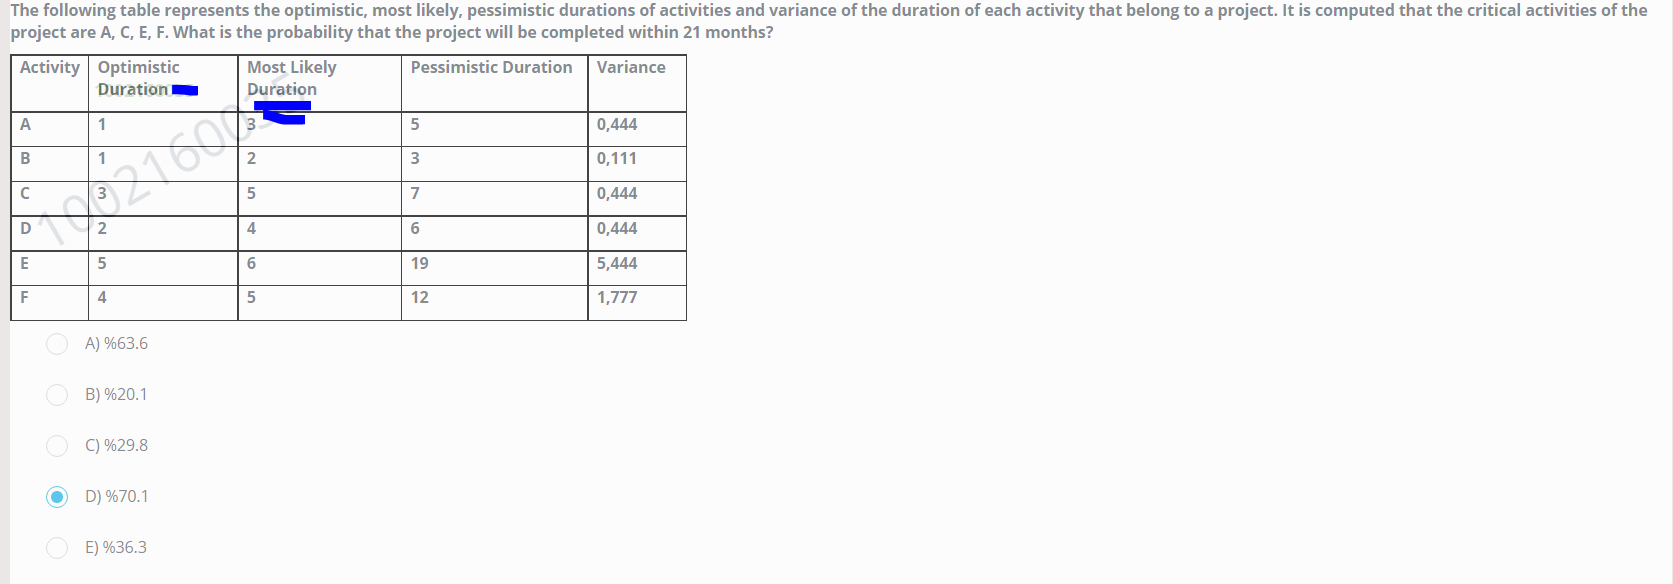
Question: The following table represents the optimistic, most likely, pessimistic durations of activities and variance of the duration of each activity that belong to a project.

The following table represents the optimistic,

The following table represents the optimistic, most likely, pessimistic durations of activities and variance of the duration of each activity that belong to a project. It is computed that the critical activities of the project are A, C, E, F. What is the probability that the project will be completed within 21 months? Pessimistic Duration Variance Activity Optimistic Duration Most Likely Duration 1 5 0,444 B 1 2. 3 0,111 5 7 0,444 D 2. 4 6 0,444 E 5 6 19 5,444 F 4 5 12 1,777 A) %63.6 B) %20.1 C) %29.8 D) %70.1 E) %36.3

Step by Step Solution

There are 3 Steps involved in it

1 Expert Approved Answer
Step: 1 Unlock blur-text-image
Question Has Been Solved by an Expert!

Get step-by-step solutions from verified subject matter experts

Step: 2 Unlock
Step: 3 Unlock

Students Have Also Explored These Related General Management Questions!