

Question: The following table represents two different data sets - one for rectangyular weir, one for v - notch weir. Determine a best - fit equation
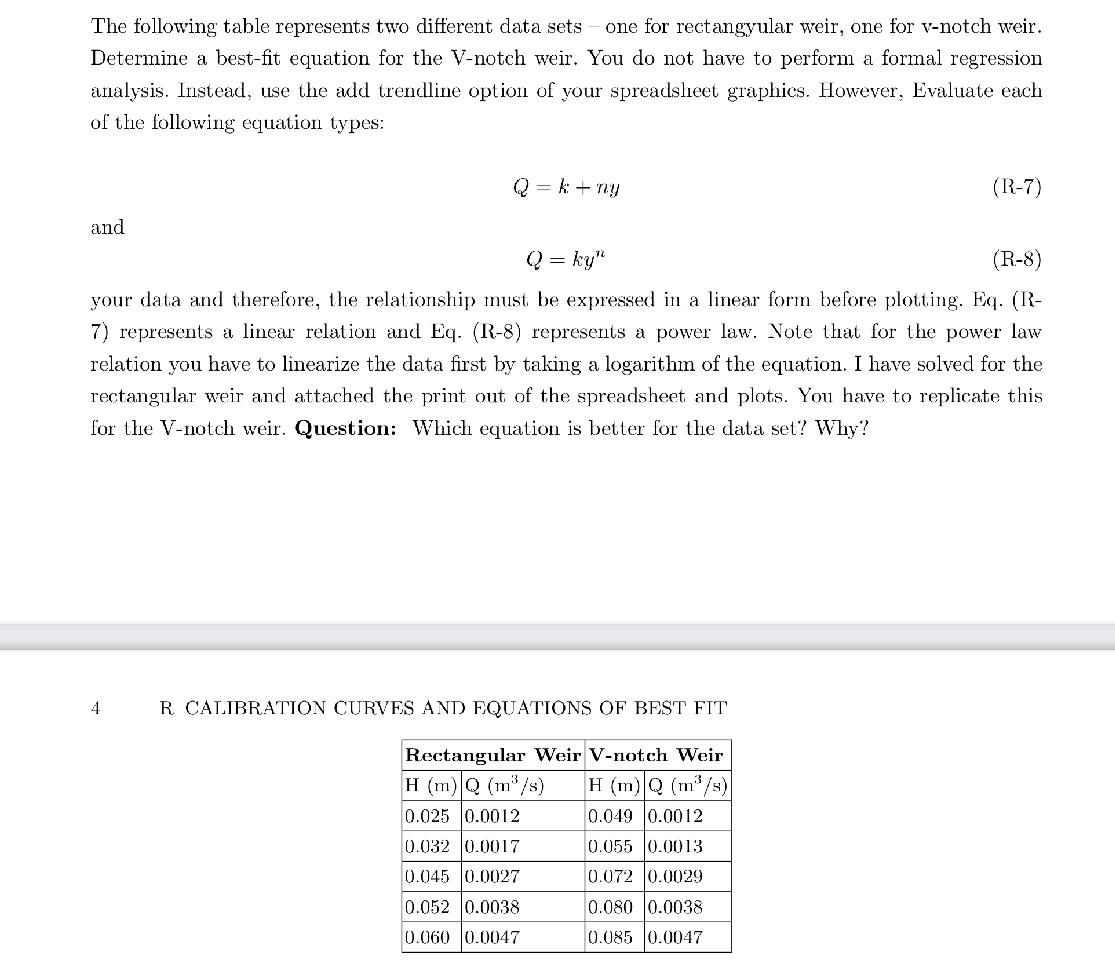
The following table represents two different data sets one for rectangyular weir, one for vnotch weir. Determine a bestfit equation for the Vnotch weir. You do not have to perform a formal regression analysis. Instead, use the add trendline option of your spreadsheet graphics. However, Evaluate each of the following equation types:
and
your data and therefore, the relationship must be expressed in a linear form before plotting. EqR represents a linear relation and R represents a power law. Note that for the power law relation you have to linearize the data first by taking a logarithm of the equation. I have solved for the rectangular weir and attached the print out of the spreadsheet and plots. You have to replicate this for the Vnotch weir. Question: Which equation is better for the data set? Why?
R CALIBRATION CURVES AND EQUATIONS OF BEST FIT
tableRectangular Weir,Vnotch Weir
Step by Step Solution
There are 3 Steps involved in it
1 Expert Approved Answer
Step: 1 Unlock

Question Has Been Solved by an Expert!
Get step-by-step solutions from verified subject matter experts
Step: 2 Unlock
Step: 3 Unlock