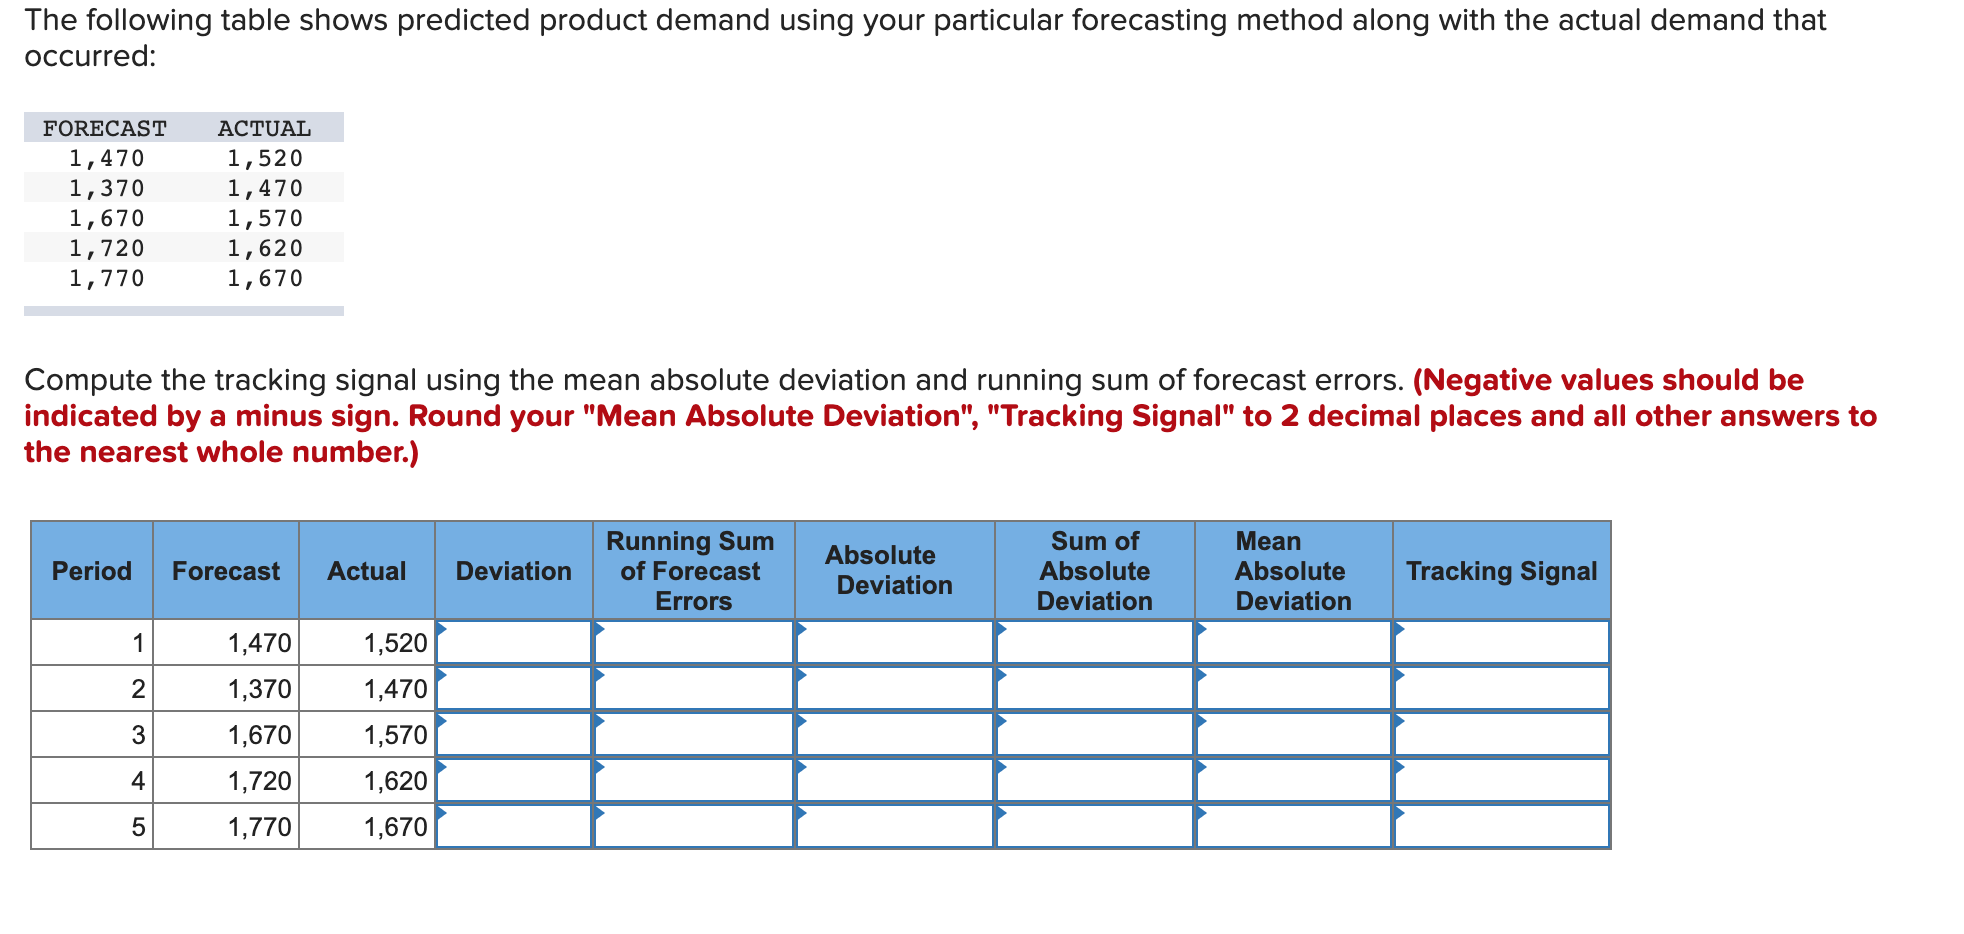
Question: The following table shows predicted product demand using your particular forecasting method along with the actual demand that occurred: FORECAST 1,470 1,370 1,670 1,720 1,770

The following table shows predicted product

The following table shows predicted product demand using your particular forecasting method along with the actual demand that occurred: FORECAST 1,470 1,370 1,670 1,720 1,770 ACTUAL 1,520 1,470 1,570 1,620 1,670 Compute the tracking signal using the mean absolute deviation and running sum of forecast errors. (Negative values should be indicated by a minus sign. Round your "Mean Absolute Deviation", "Tracking Signal" to 2 decimal places and all other answers to the nearest whole number.) Period Forecast Actual Deviation Running Sum of Forecast Errors Absolute Deviation Sum of Absolute Deviation Mean Absolute Deviation Tracking Signal 1 2 3 1,470 1,370 1,670 1,720 1,770 1,520 1,470 1,570 1,620 1,670 4 5

Step by Step Solution

There are 3 Steps involved in it

1 Expert Approved Answer
Step: 1 Unlock blur-text-image
Question Has Been Solved by an Expert!

Get step-by-step solutions from verified subject matter experts

Step: 2 Unlock
Step: 3 Unlock

Students Have Also Explored These Related General Management Questions!