

Question: The following table shows the aggregate supply and demand data for a country. The current equilibrium is at price level 4 0 0 . However,
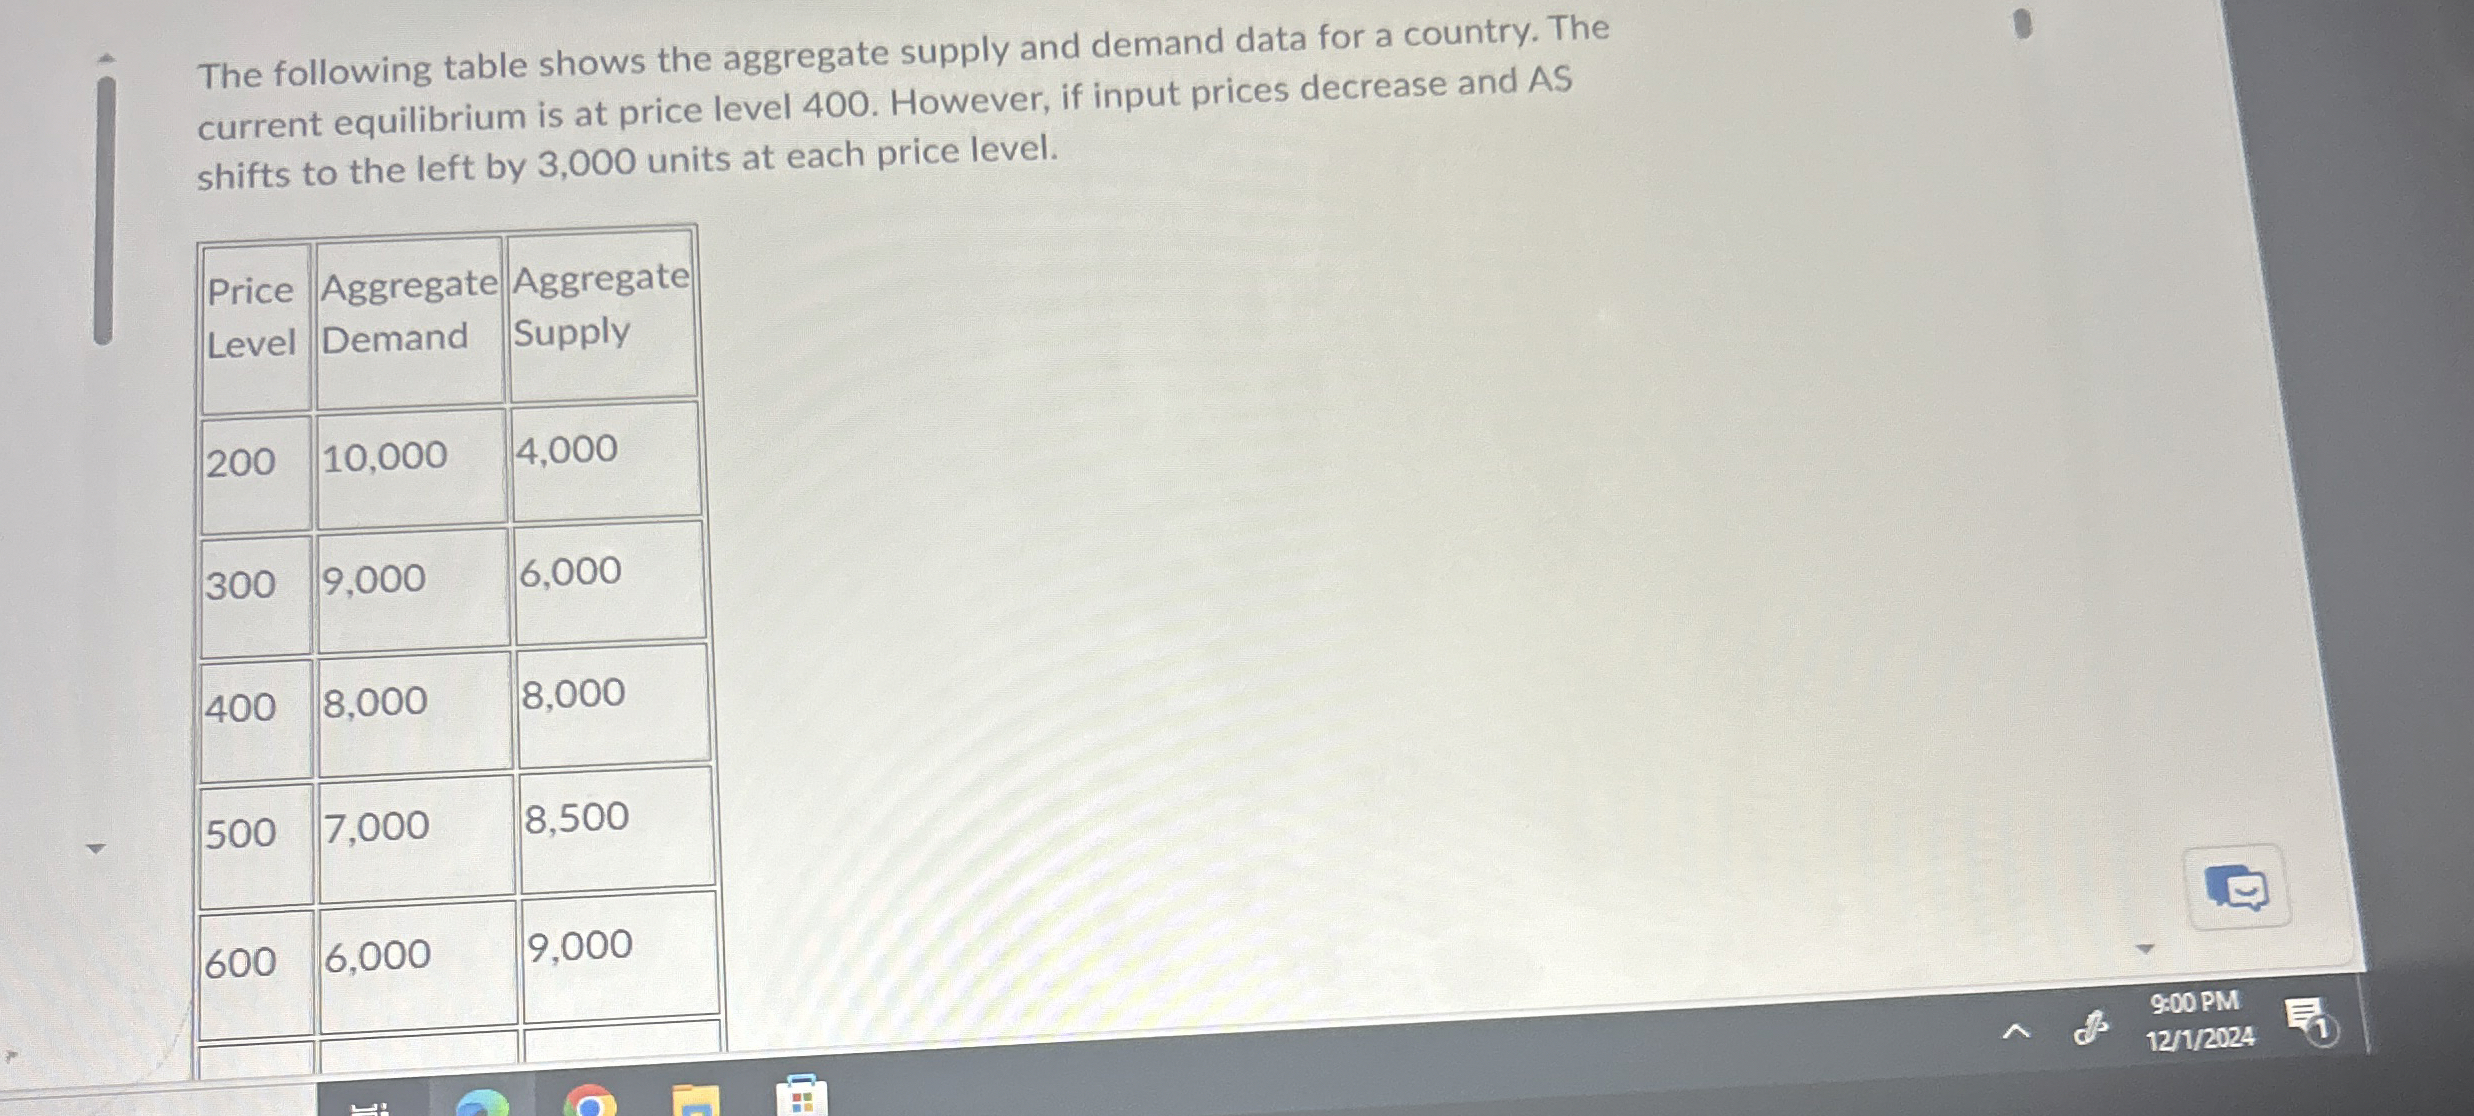
The following table shows the aggregate supply and demand data for a country. The current equilibrium is at price level However, if input prices decrease and AS shifts to the left by units at each price level.
tabletablePriceLeveltableAggregateDemandtableAggregateSupply
Step by Step Solution
There are 3 Steps involved in it
1 Expert Approved Answer
Step: 1 Unlock

Question Has Been Solved by an Expert!
Get step-by-step solutions from verified subject matter experts
Step: 2 Unlock
Step: 3 Unlock