

Question: The following table shows the data collected from 4 random samples of 50 students from a small middle school regarding the type of television shows
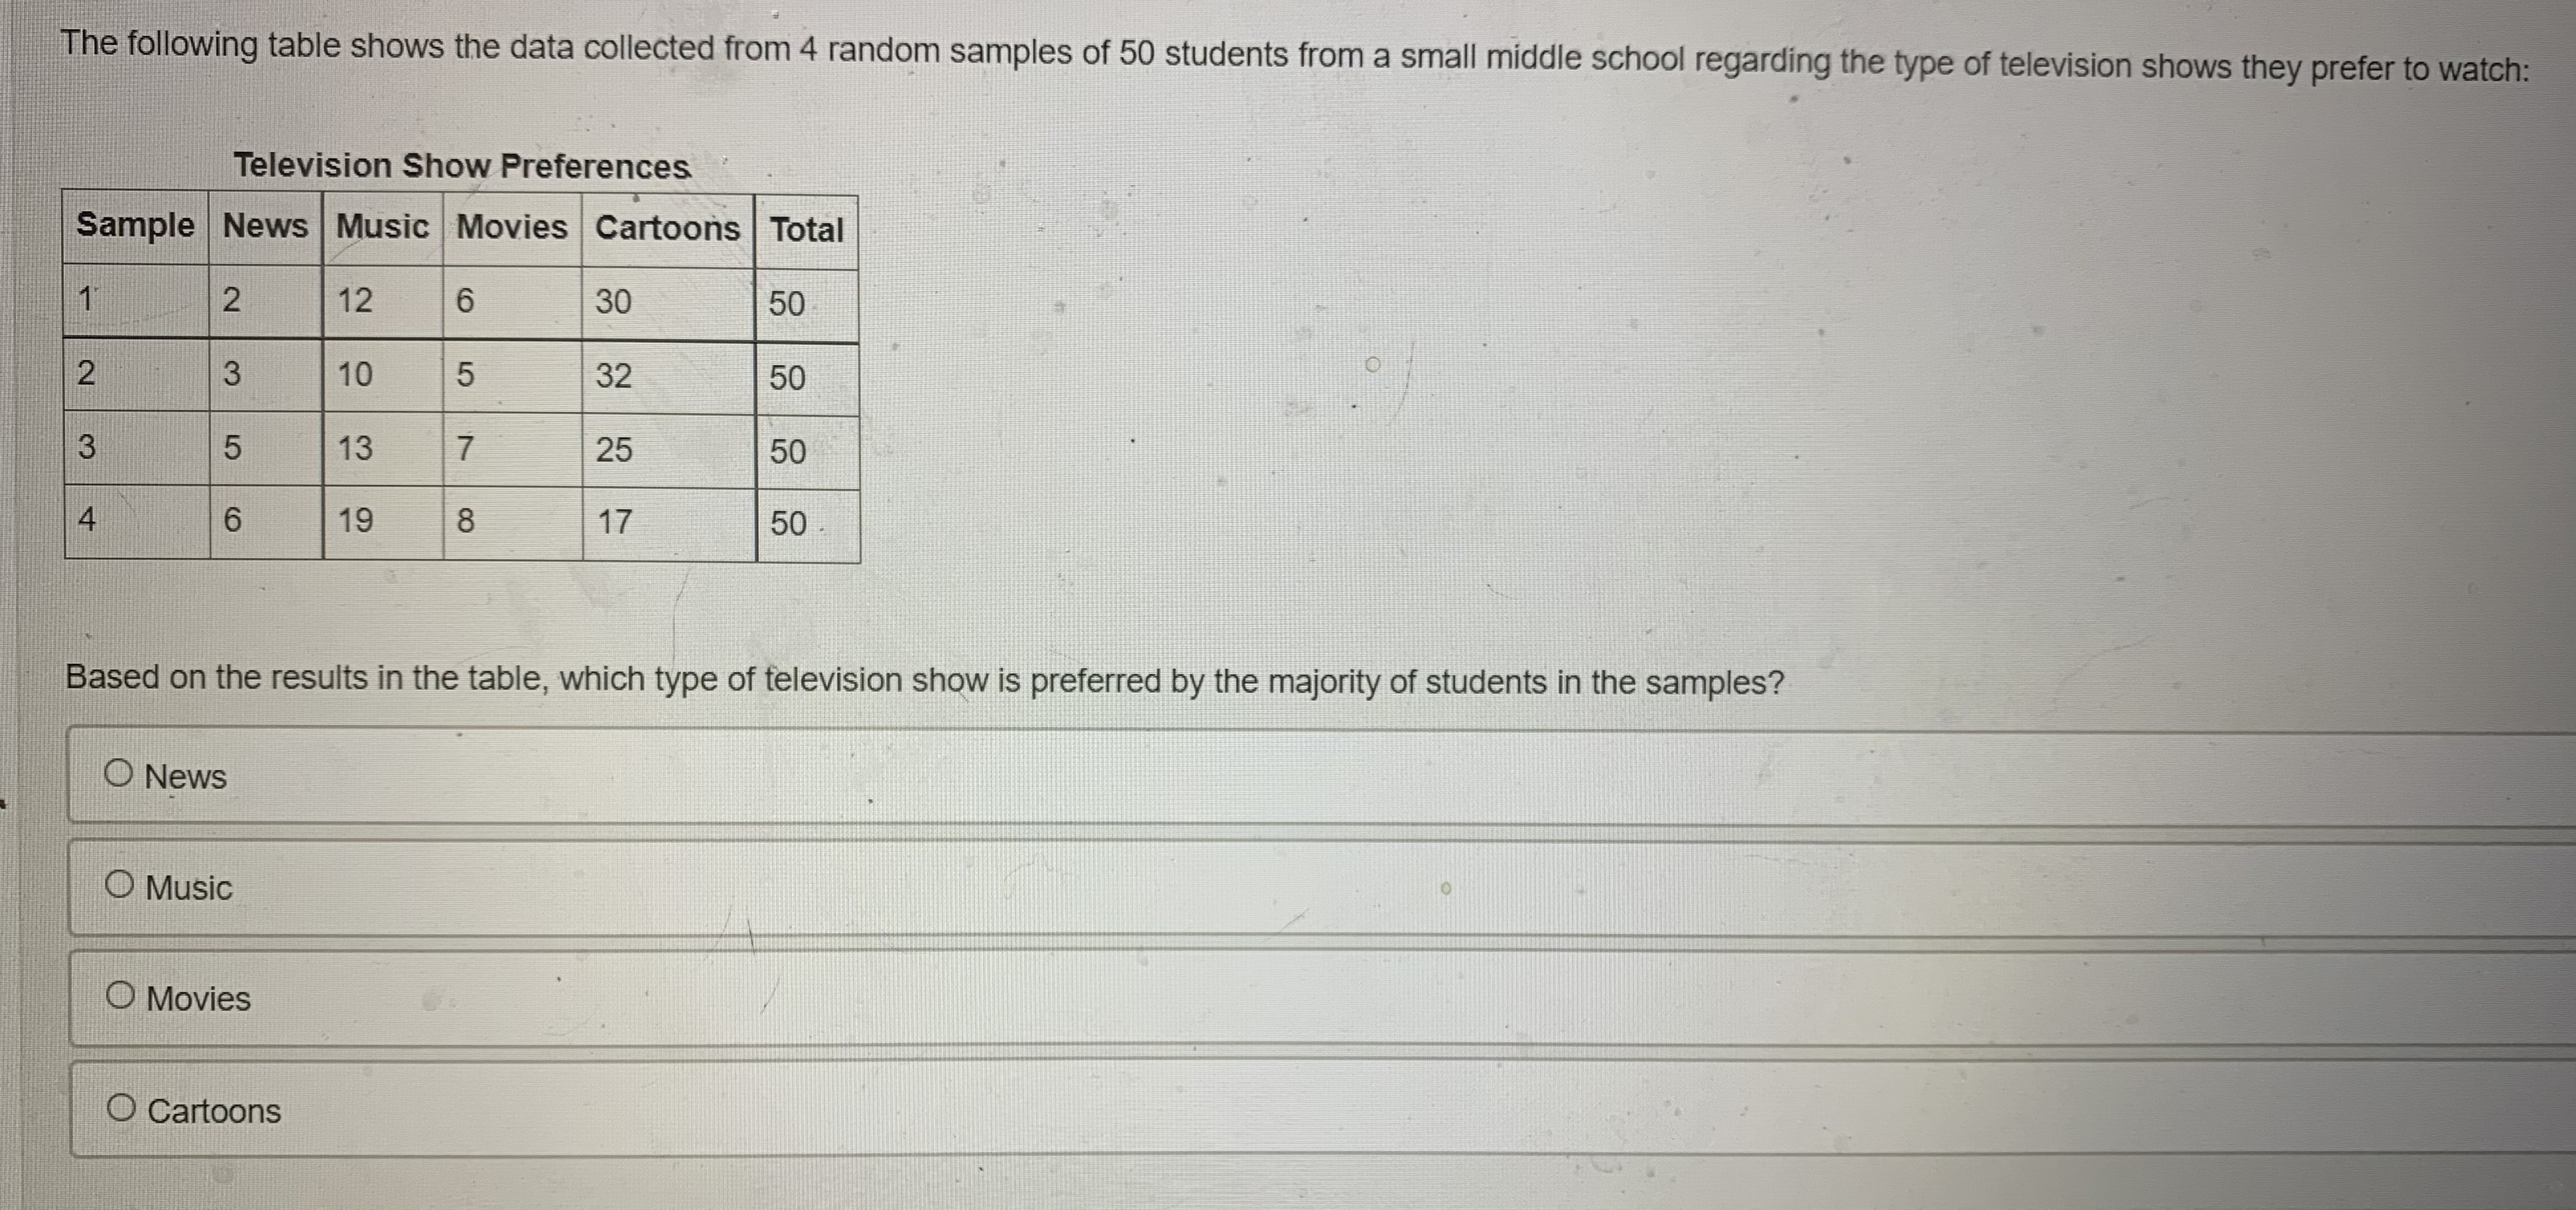
The following table shows the data collected from 4 random samples of 50 students from a small middle school regarding the type of television shows they prefer to watch: Television Show Preferences Sample News | Music Movies Cartoons Total 2 12 6 30 50 2 3 10 5 32 50 3 5 13 7 25 50 4 6 19 8 17 50 Based on the results in the table, which type of television show is preferred by the majority of students in the samples? O News Music Movies O Cartoons
Step by Step Solution
There are 3 Steps involved in it
1 Expert Approved Answer
Step: 1 Unlock

Question Has Been Solved by an Expert!
Get step-by-step solutions from verified subject matter experts
Step: 2 Unlock
Step: 3 Unlock