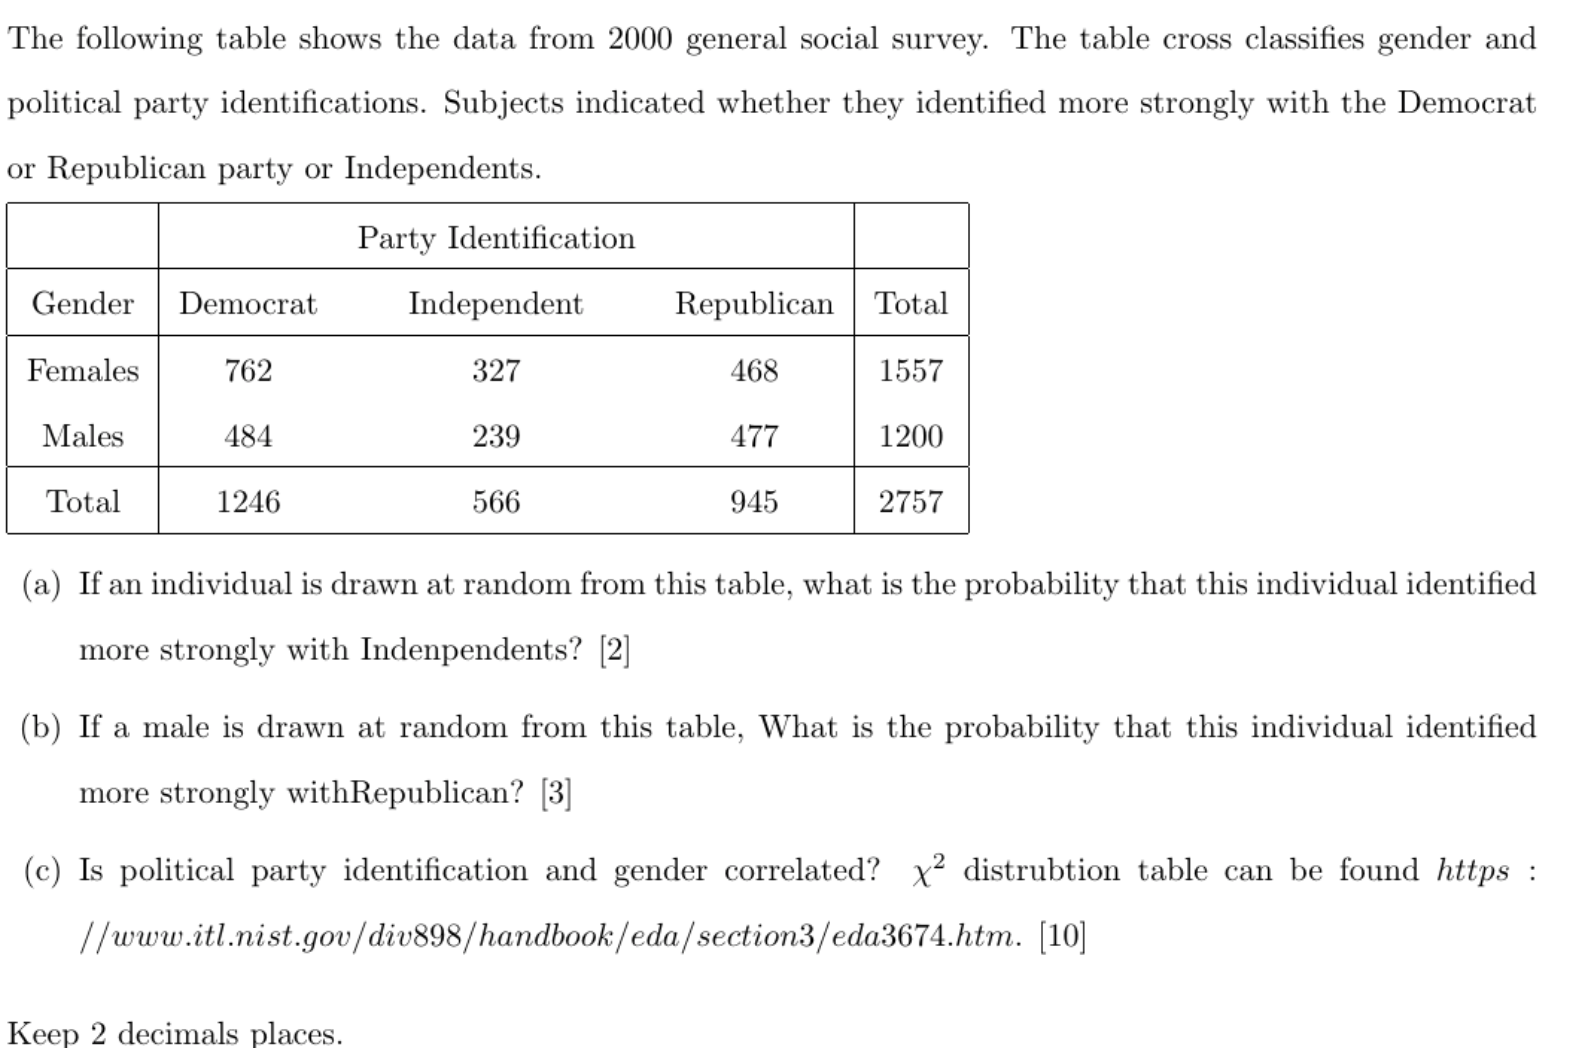
Question: The following table shows the data from 2000 general social survey. The table cross classifies gender and political party identifications. Subjects indicated whether they identified

The following table shows the data from 2000
The following table shows the data from 2000 general social survey. The table cross classifies gender and political party identifications. Subjects indicated whether they identified more strongly with the Democrat or Republican party or Independents. Party Identification Gender Democrat Independent Republican Total Females 762 327 468 1557 Males 484 239 477 1200 Total 1246 566 945 2757 (a) If an individual is drawn at random from this table, what is the probability that this individual identified more strongly with Indenpendents? [2] (b) If a male is drawn at random from this table, What is the probability that this individual identified more strongly withRepublican? [3] (c) Is political party identification and gender correlated? x2 distrubtion table can be found https : / /www.itl.nist.gov/div898/handbook/eda/ section3/eda3674.htm. [10] Keep 2 decimals places

Step by Step Solution

There are 3 Steps involved in it

1 Expert Approved Answer
Step: 1 Unlock blur-text-image
Question Has Been Solved by an Expert!

Get step-by-step solutions from verified subject matter experts

Step: 2 Unlock
Step: 3 Unlock

Students Have Also Explored These Related Mathematics Questions!