

Question: The following table shows the mean, standard deviation, 10th, 25th 75th, and 90th percentiles for students' grades in classes A and B. Mean SD
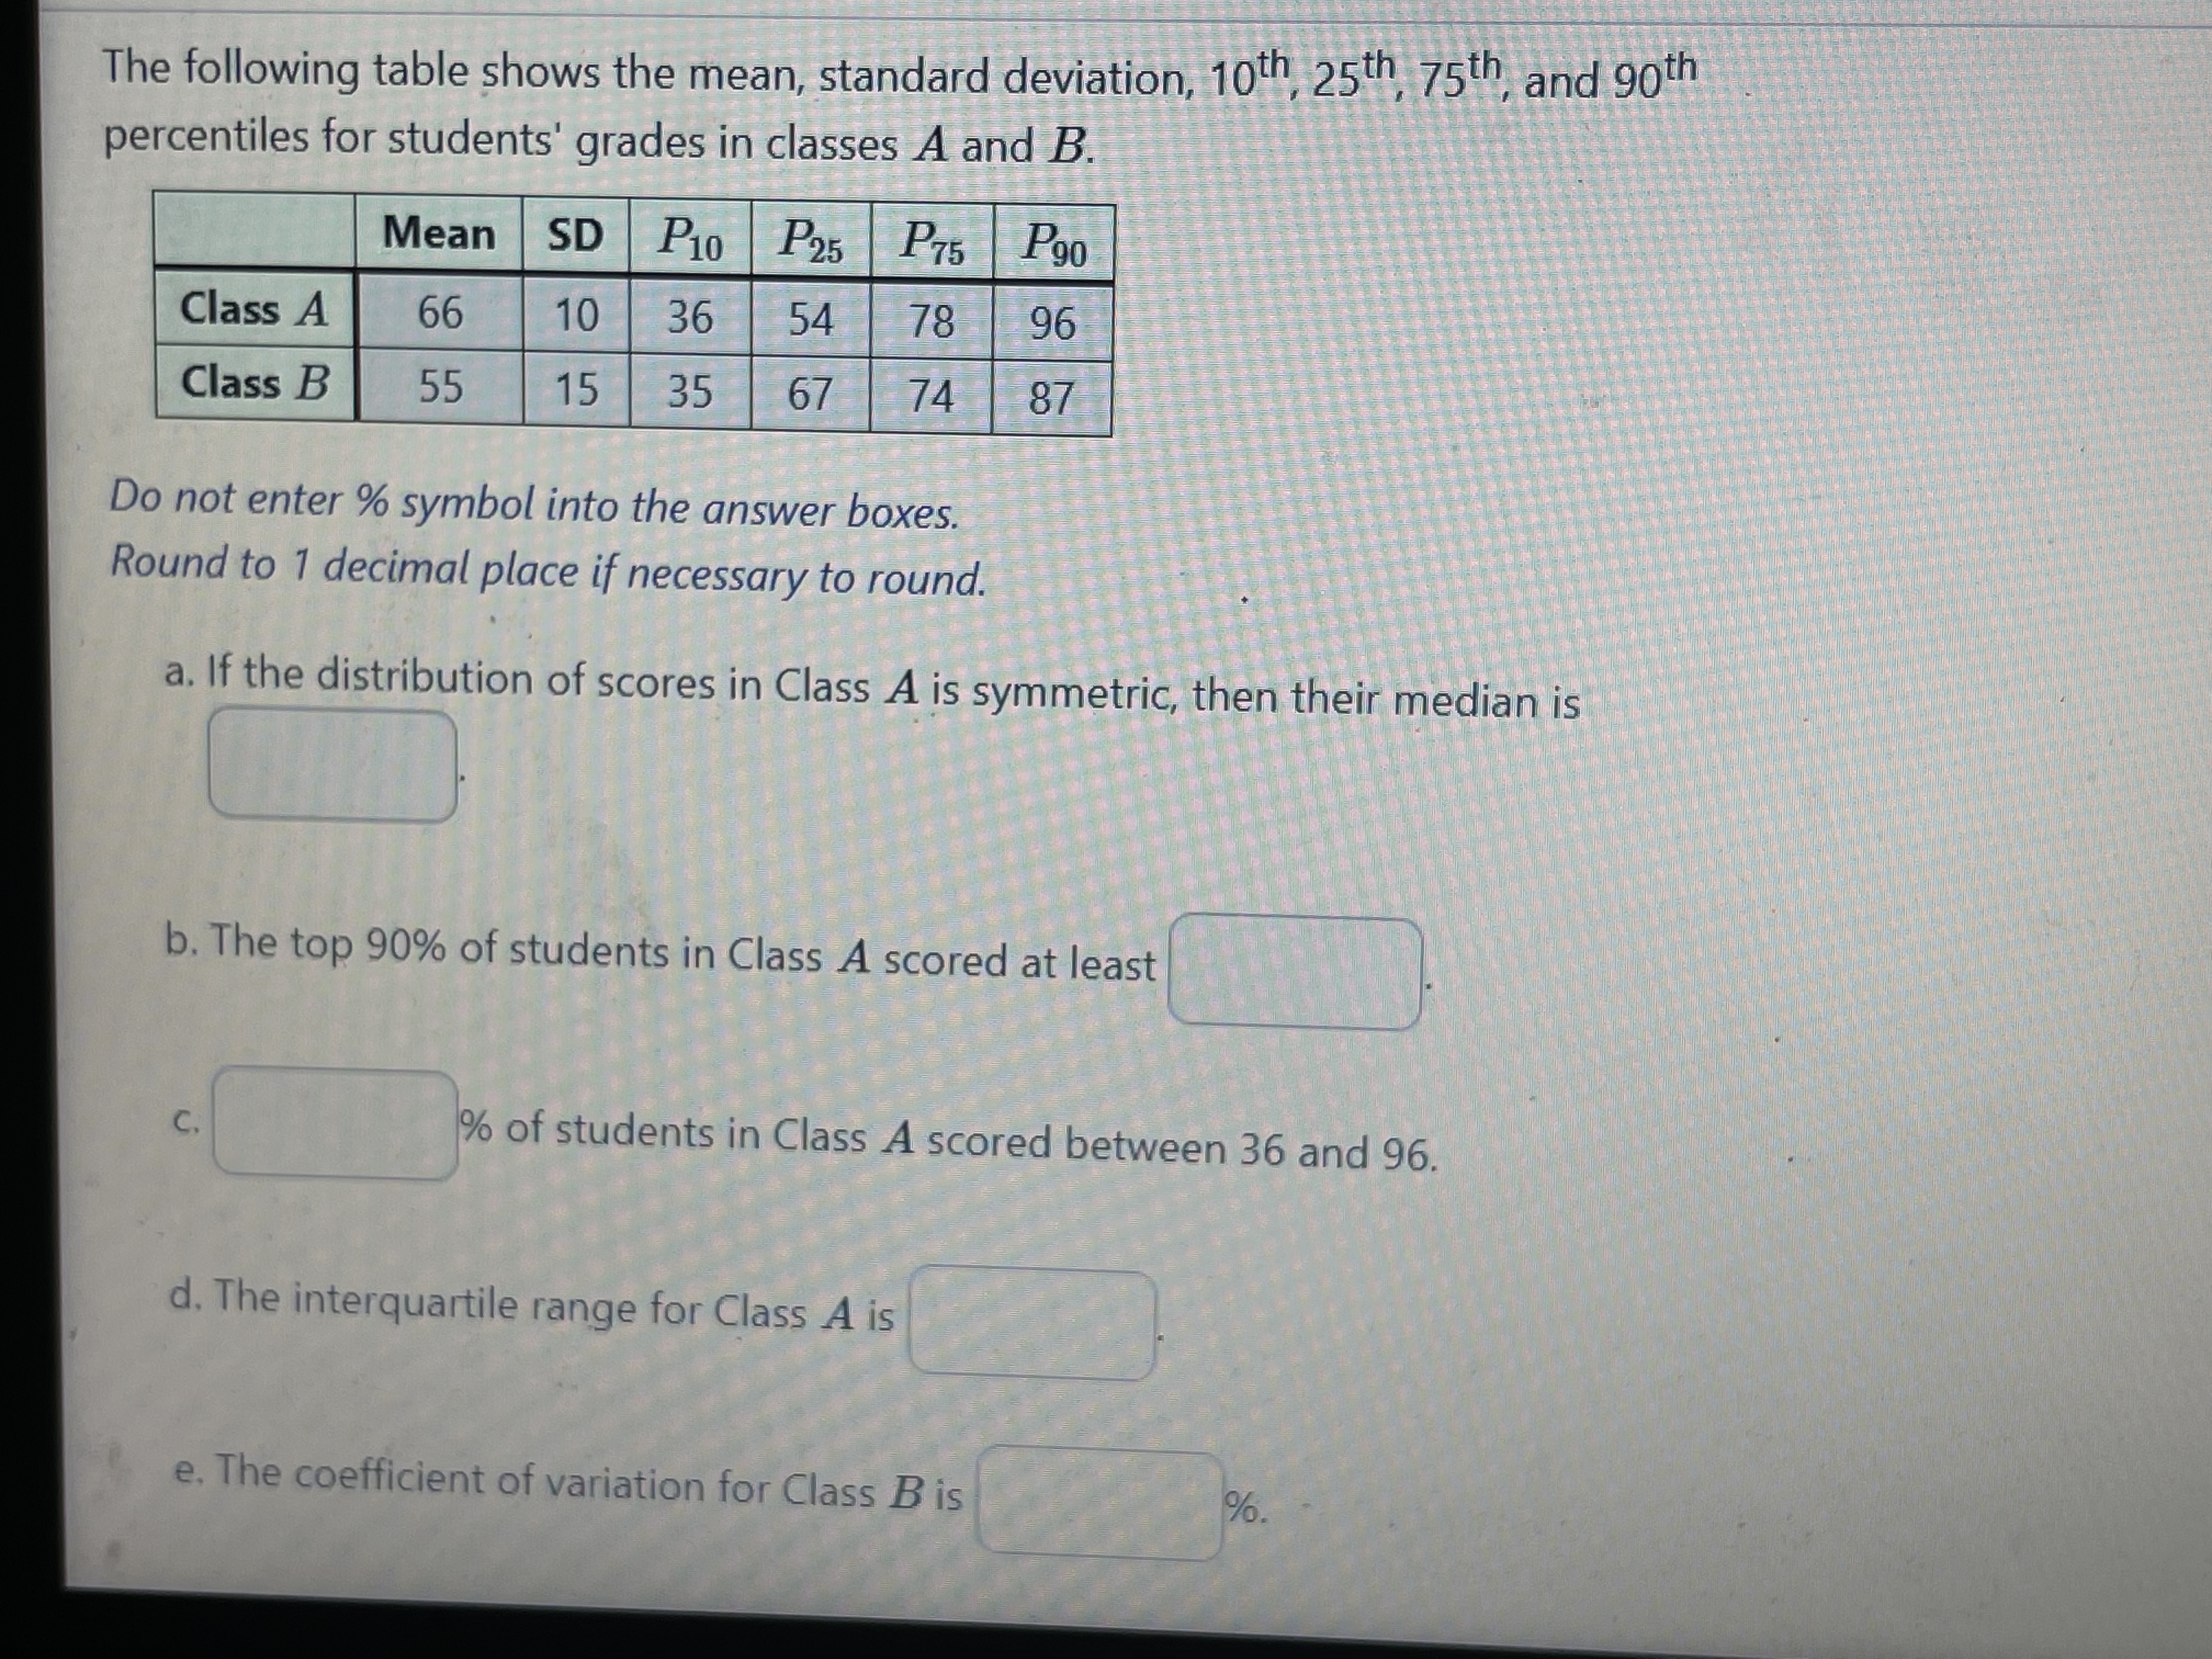
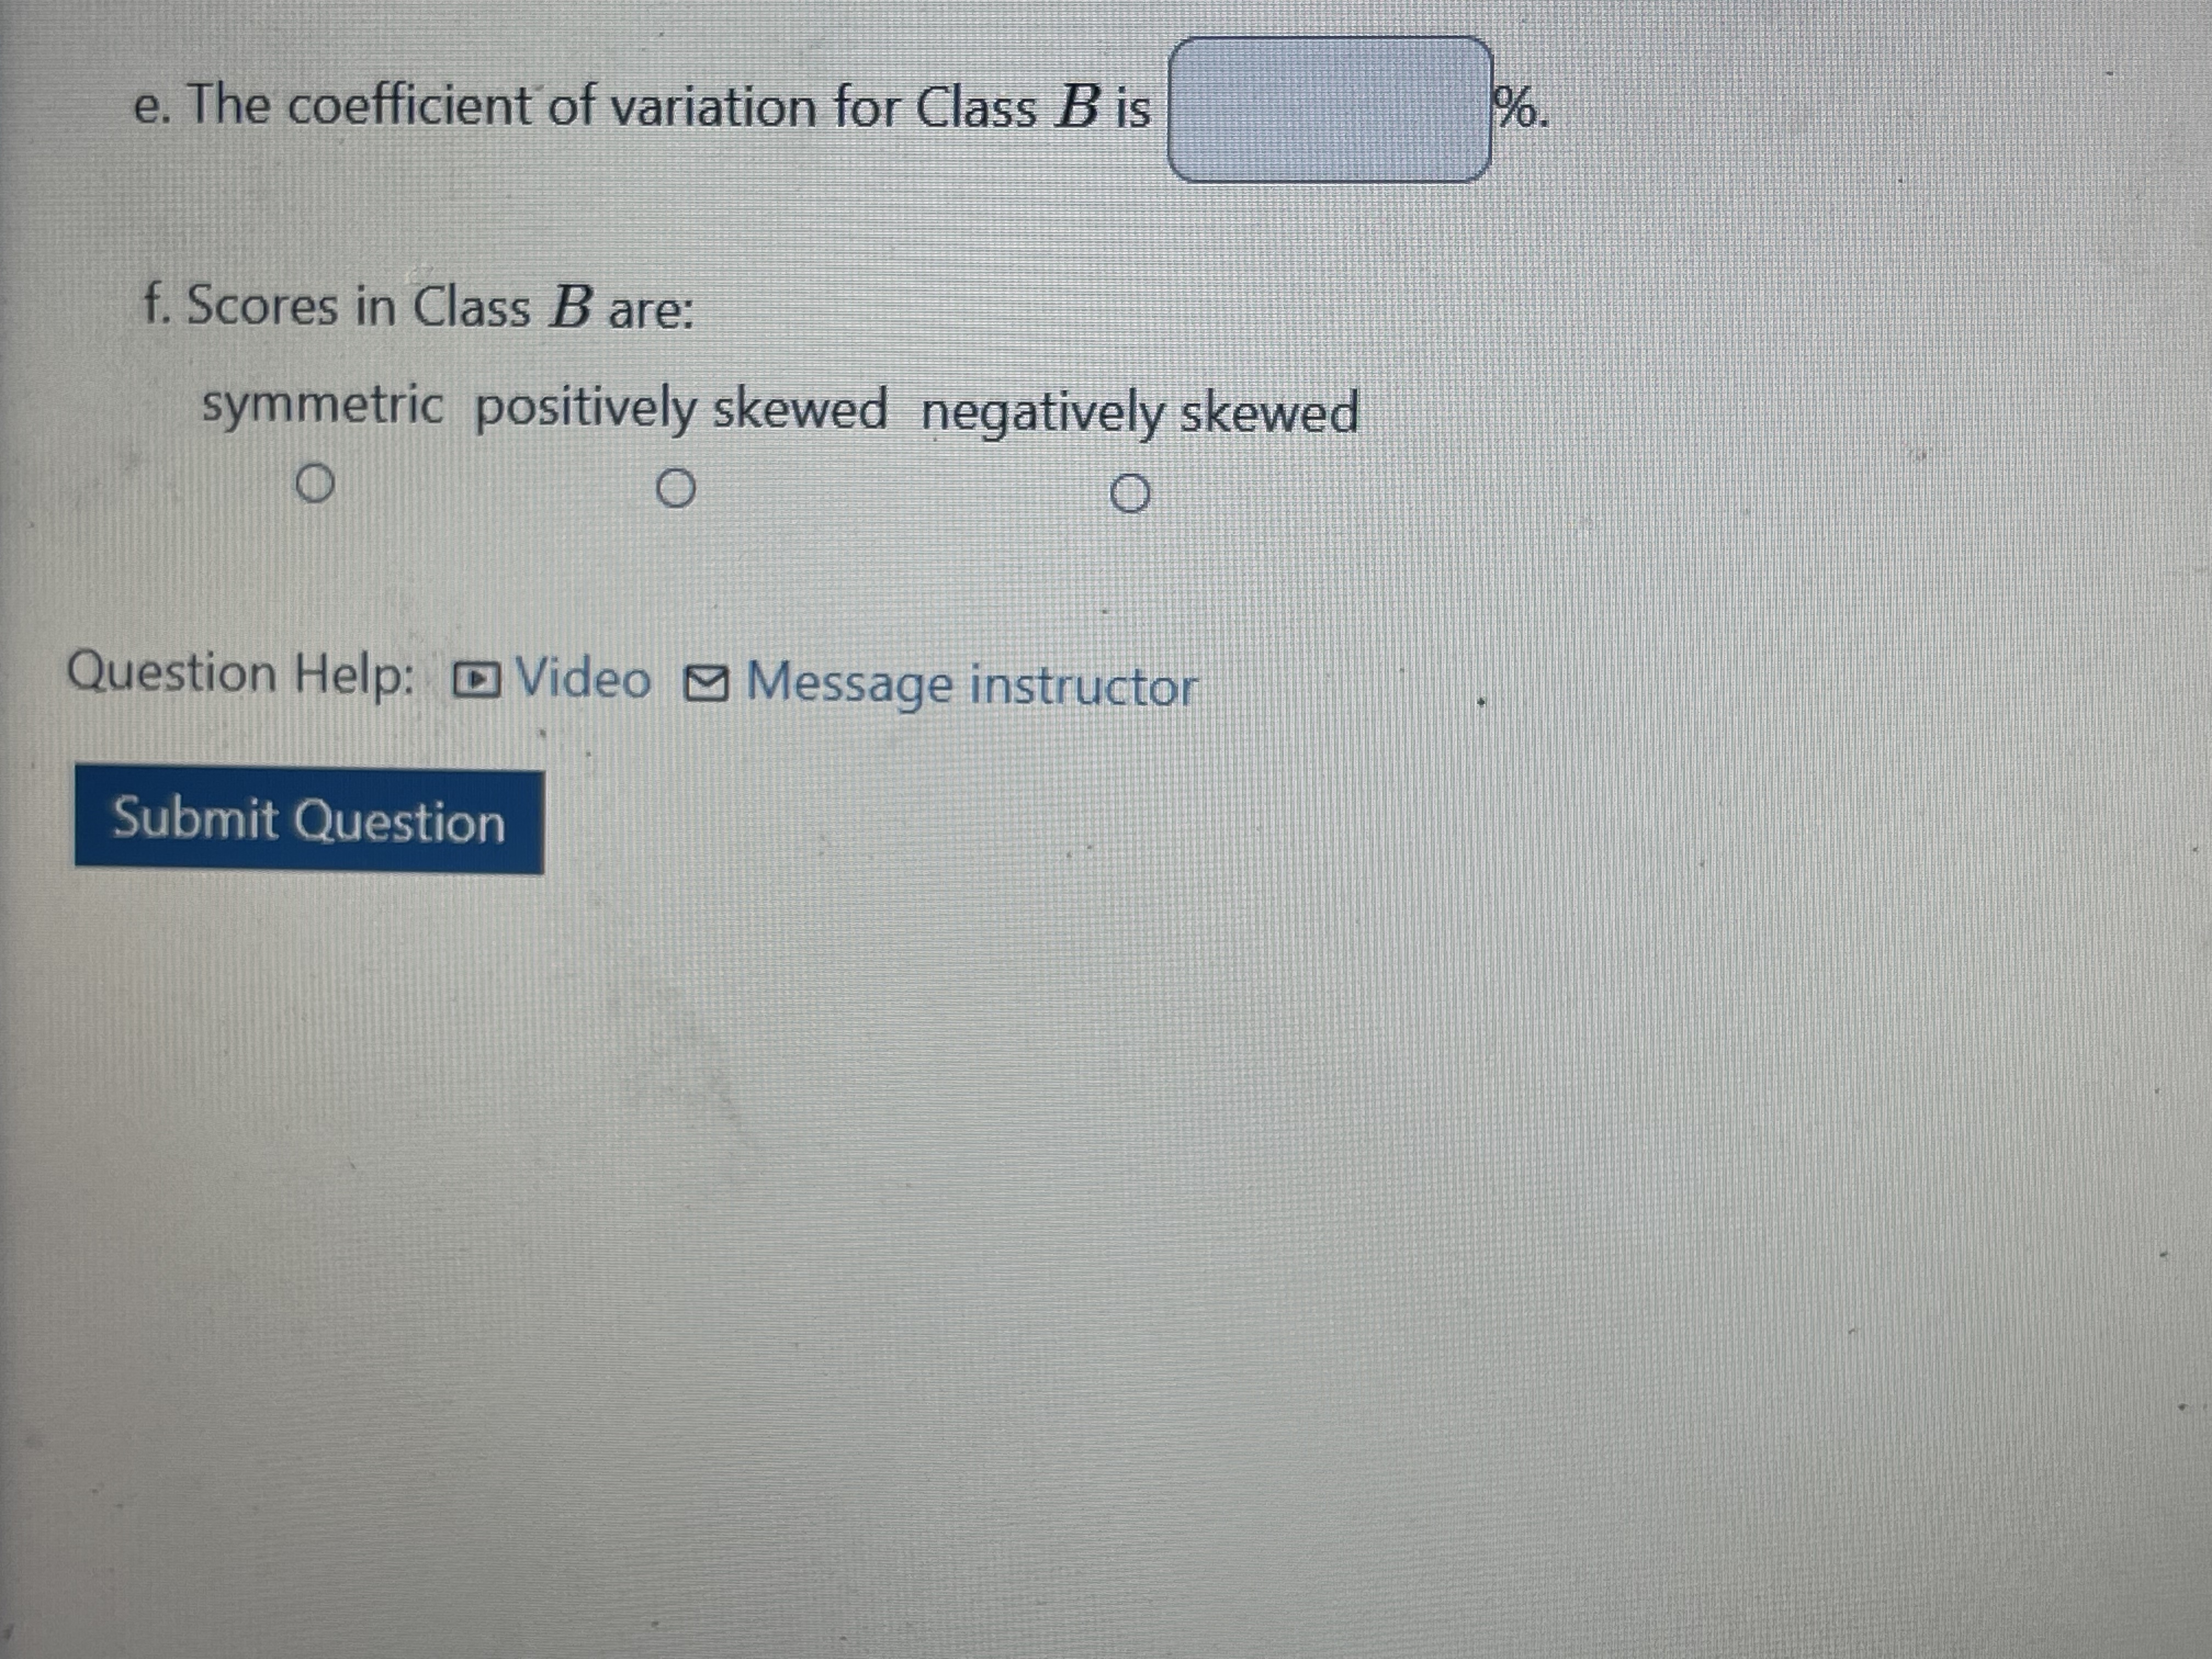
The following table shows the mean, standard deviation, 10th, 25th 75th, and 90th percentiles for students' grades in classes A and B. Mean SD P10 P25 P75 P90 Class A 66 10 36 54 78 96 Class B 55 15 35 67 74 87 Do not enter % symbol into the answer boxes. Round to 1 decimal place if necessary to round. a. If the distribution of scores in Class A is symmetric, then their median is b. The top 90% of students in Class A scored at least C. % of students in Class A scored between 36 and 96. d. The interquartile range for Class A is e. The coefficient of variation for Class B is %. e. The coefficient of variation for Class B is f. Scores in Class B are: symmetric positively skewed negatively skewed O O Question Help: Video Message instructor Submit Question %.
Step by Step Solution
There are 3 Steps involved in it

Get step-by-step solutions from verified subject matter experts