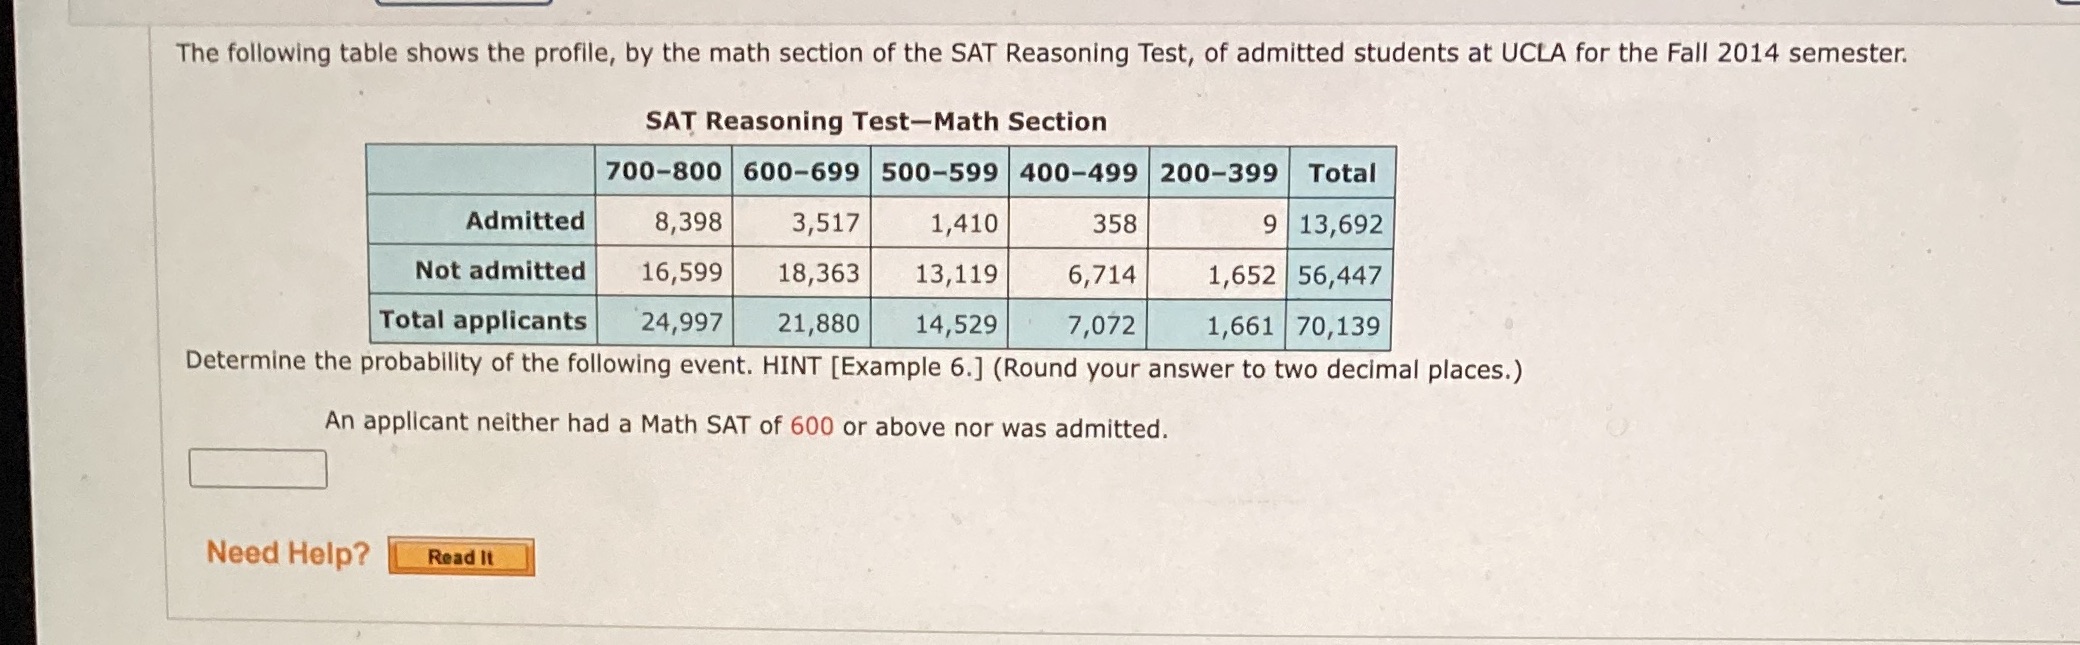
Question: . The following table shows the profile, by the math section of the SAT Reasoning Test, of admitted students at UCLA for the Fall 2014

. The following table shows the profile, by the
. The following table shows the profile, by the math section of the SAT Reasoning Test, of admitted students at UCLA for the Fall 2014 semester. SAT Reasoning TestMath Section -W Admitted 8,398 Not admitted 1,652 56,447 .......,........ Determine the probability of the following event. HINT [Example 6.] (Round your answer to two decimal places.) An applicant neither had a Math SAT of 600 or above nor was admitted. Z Need Help

Step by Step Solution

There are 3 Steps involved in it

1 Expert Approved Answer
Step: 1 Unlock blur-text-image
Question Has Been Solved by an Expert!

Get step-by-step solutions from verified subject matter experts

Step: 2 Unlock
Step: 3 Unlock

Students Have Also Explored These Related Mathematics Questions!