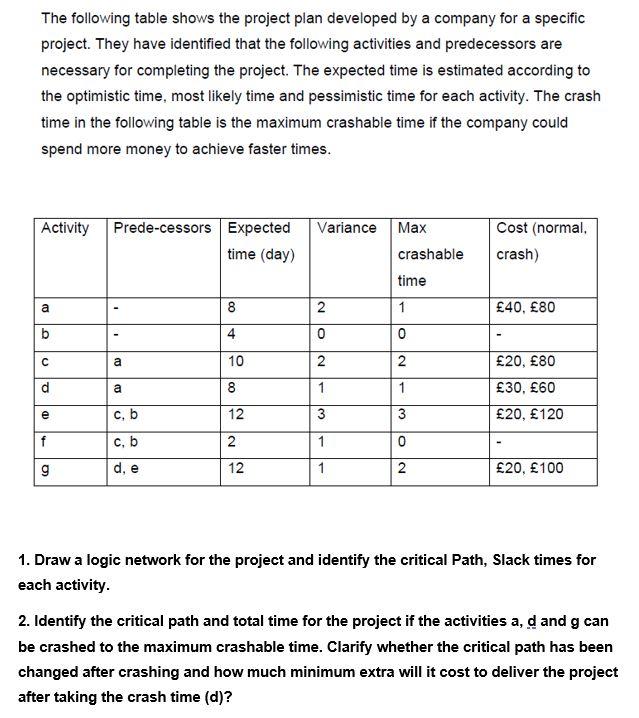
Question: The following table shows the project plan developed by a company for a specific project. They have identified that the following activities and predecessors are

The following table shows the project plan

The following table shows the project plan developed by a company for a specific project. They have identified that the following activities and predecessors are necessary for completing the project. The expected time is estimated according to the optimistic time, most likely time and pessimistic time for each activity. The crash time in the following table is the maximum crashable time if the company could spend more money to achieve faster times. Activity Predecessors Expected time (day) Cost (normal. crash) Variance Max crashable time 2 1 0 0 a 8 40, 80 2 0 b 4 a 10 N 2 d a 8 1 1 1 20, 80 30, 60 20, 120 e c. b 12 3 f c. b 2 1 Now g d, e 12 1 20, 100 1. Draw a logic network for the project and identify the critical Path, Slack times for each activity. 2. Identify the critical path and total time for the project if the activities a, d and g can be crashed to the maximum crashable time. Clarify whether the critical path has been changed after crashing and how much minimum extra will it cost to deliver the project after taking the crash time (d)

Step by Step Solution

There are 3 Steps involved in it

1 Expert Approved Answer
Step: 1 Unlock blur-text-image
Question Has Been Solved by an Expert!

Get step-by-step solutions from verified subject matter experts

Step: 2 Unlock
Step: 3 Unlock

Students Have Also Explored These Related General Management Questions!