

Question: The following table shows the time data run at different temperatures as described in Step 5 of the experimental procedure. Copy the concentration data from
The following table shows the time data run at different temperatures as described in Step 5 of the experimental procedure. Copy the concentration data from Reaction Mixture 1 above, and calculate the rate of each trial.
Reaction Mixture | [I-]o | [BrO3-]o | [H+]o | Temp. | Time | Rate |
1 | 40.0 oC | 44 sec | ||||
1 | 7.0 oC | 371 sec | ||||
1 | 1.0 oC | 480 sec |
Reaction Mixture | [I-]o | [BrO3-]o | [H+]o | Temp. | Time | Rate |
1 | 0.0020M | 0.008M | 0.02M | 19.0 oC | 182 sec | 1.0989x10⁻⁶Ms-1 |
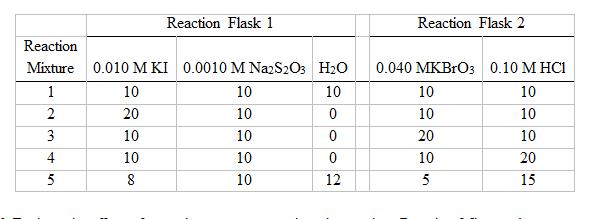
Reaction Flask 1 Reaction Flask 2 Reaction Mixture 0.010 M KI 0.0010 M NazS2Os H2O 0.040 MKBrO3 0.10 M HCI 10 10 10 10 10 20 10 10 10 3 10 10 20 10 4 10 10 10 20 5 8 10 12 5 15 12
Step by Step Solution
3.31 Rating (151 Votes )
There are 3 Steps involved in it

Get step-by-step solutions from verified subject matter experts