

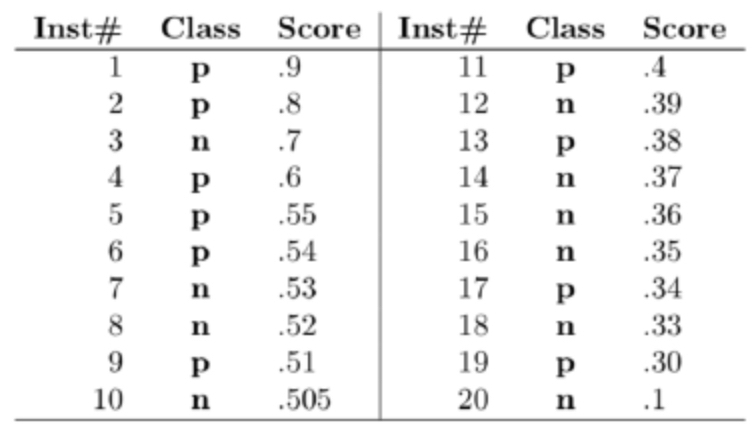
Question: The following table shows twenty testing data points and the score assigned to each by a classifier. ( In logistic regression, the score is the
The following table shows twenty testing data points and the score assigned to each by a classifier. In logistic regression, the score is the probability output of data being positive; In decision tree, the score is the positive data proportion in the corresponding leaf node Draw the ROC curve for this classifier and write down detailed steps. For each decision threshold, you need to write down the confusion matrix as well as corresponding true positive rate and false positive rate. Hint: you should calculate the FPR and TPR under different decision threshold, plot and connect them together on the graph. By threshold x we are saying if probability estimatex we predict it as p; otherwise, we predict it as nThis exercise require you to do the manual calculation, do not use python to do the work.
Step by Step Solution
There are 3 Steps involved in it
1 Expert Approved Answer
Step: 1 Unlock

Question Has Been Solved by an Expert!
Get step-by-step solutions from verified subject matter experts
Step: 2 Unlock
Step: 3 Unlock