

Question: The Following Table Summarizes The Information Used For Hypothesis Testing . Complete The Table 5. The following table summarizes the information used for hypothesis testing.
The Following Table Summarizes The Information Used For Hypothesis Testing. Complete The Table
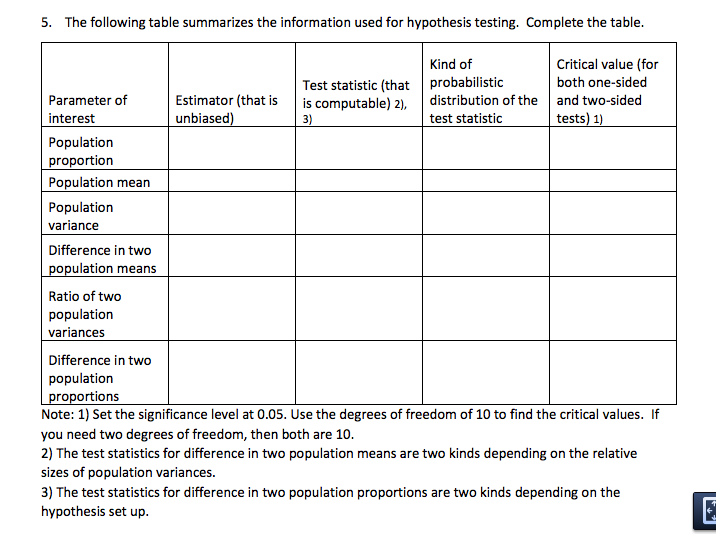
5. The following table summarizes the information used for hypothesis testing. Complete the table. Kind of Critical value (for Test statistic (that probabilistic both one-sided Parameter of Estimator (that is is computable) 2), distribution of the and two-sided interest unbiased 3) test statistic tests) 1) Population proportion Population mean Population variance Difference in two population means Ratio of two population variances Difference in two population proportions Note: 1) Set the significance level at 0.05. Use the degrees of freedom of 10 to find the critical values. If you need two degrees of freedom, then both are 10. 2) The test statistics for difference in two population means are two kinds depending on the relative sizes of population variances. 3) The test statistics for difference in two population proportions are two kinds depending on the hypothesis set up
Step by Step Solution
There are 3 Steps involved in it

Get step-by-step solutions from verified subject matter experts