

The following tables present the number of specimens that tested positive for Type A and Type B
Fantastic news! We've Found the answer you've been seeking!
Question:
The following tables present the number of specimens that tested positive for Type A and Type B influenza in the United States during the first 15 weeks of the 2012–13 flu season.
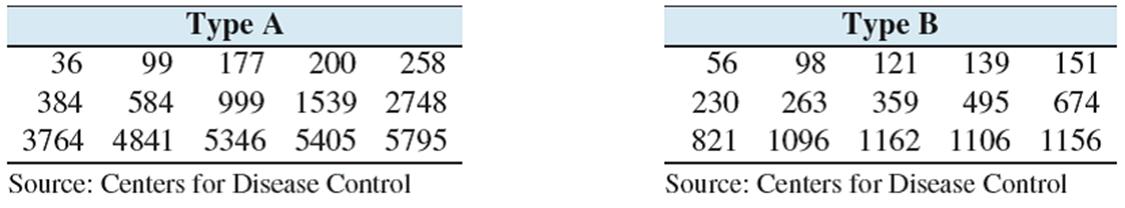
a. Find the mean and median number of Type A cases in the first fifteen weeks of the flu season.
b. Find the mean and median number of Type B cases in the first fifteen weeks of the flu season.
c. A public health official says that there are more than twice as many cases of Type A influenza as Type B. Do these data support this claim?
Expert Answer:

Related Book For 

Quantitative Analysis for Management
ISBN: 978-0132149112
11th Edition
Authors: Barry render, Ralph m. stair, Michael e. Hanna
Posted Date:
