

Question: The following tables were created from my assignment data in SPSS. Model Summary Adjusted R Std. Error of Model R R Square Square the Estimate
The following tables were created from my assignment data in SPSS.
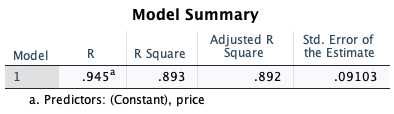
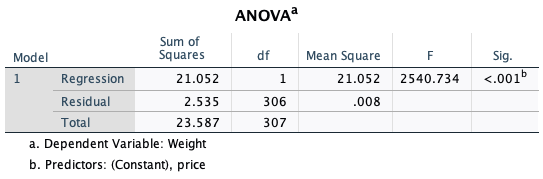
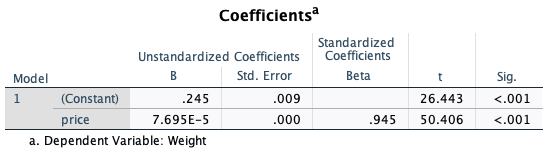
Model Summary Adjusted R Std. Error of Model R R Square Square the Estimate .945 .893 .892 .09103 a. Predictors: (Constant), priceANOVA Sum of Model Squares df Mean Square F Sig. 1 Regression 21.052 1 21.052 2540.734 <.001 residual .008 total a. dependent variable: weight b. predictors: pricecoefficients standardized unstandardized coefficients model b std. error beta sig. .245 .009 price .000 .945>
Step by Step Solution
There are 3 Steps involved in it
1 Expert Approved Answer
Step: 1 Unlock

Question Has Been Solved by an Expert!
Get step-by-step solutions from verified subject matter experts
Step: 2 Unlock
Step: 3 Unlock