

Question: The following task graph (Figure 1) represents a parallel program with 7 tasks, each task node is labelled with the time it takes to
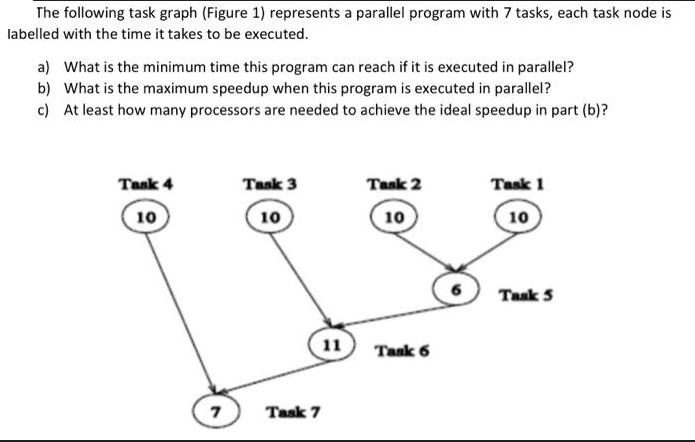
The following task graph (Figure 1) represents a parallel program with 7 tasks, each task node is labelled with the time it takes to be executed. a) What is the minimum time this program can reach if it is executed in parallel? b) What is the maximum speedup when this program is executed in parallel? c) At least how many processors are needed to achieve the ideal speedup in part (b)? Task 4 10 7 Task 3 10 Task 7 11 Task 2 10 Tank 6 Task 1 10 Task 5
Step by Step Solution
There are 3 Steps involved in it
The provided image shows a task graph with 7 tasks where each node task is labeled with the time it takes to be executed To address the questions a Th... View full answer

Get step-by-step solutions from verified subject matter experts