

Question: The following three questions are based on the same content. Weekly demand for cell phones at a retailer is normally distributed with a mean of
The following three questions are based on the same content.
Weekly demand for cell phones at a retailer is normally distributed with a mean of 150 phones and a standard deviation of 75. The retailer replenishes inventory by ordering from a distributor, with a lead time of two weeks. Currently, the store continuously monitors the inventory of phones, and achieves an in-stock probability of 95%.
What is the amount of safety stock for phones (no decimals)? Use Table 13.4
If the reorder point was set to 400 cell phones, the in-stock probability would be at least how much (as a numerical value with 4 decimals)? Use Table 13.4
If the fixed ordering cost from the supplier is $100, and the weekly holding cost per phone is valued at $1.50. What should be the optimal order quantity?
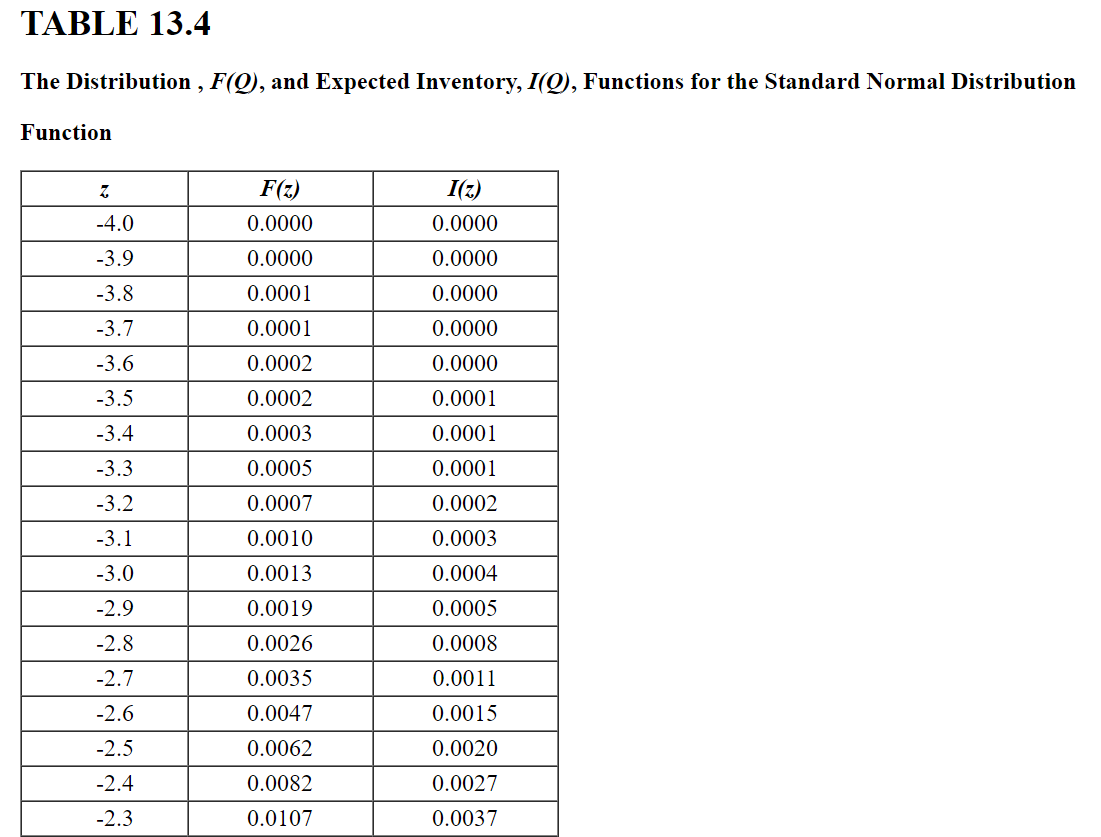
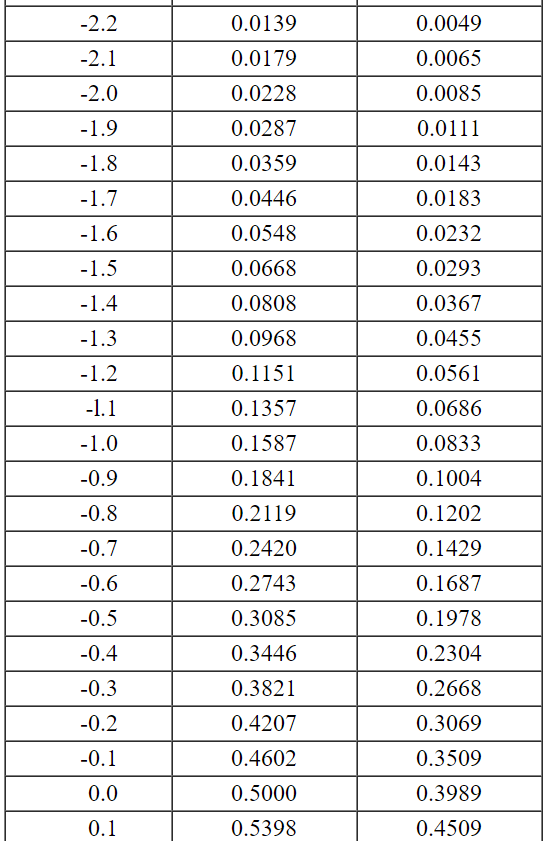
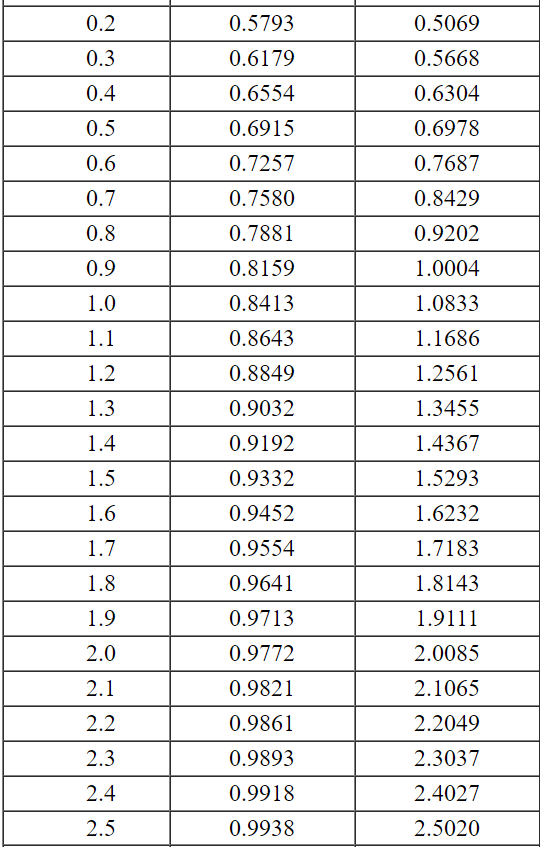
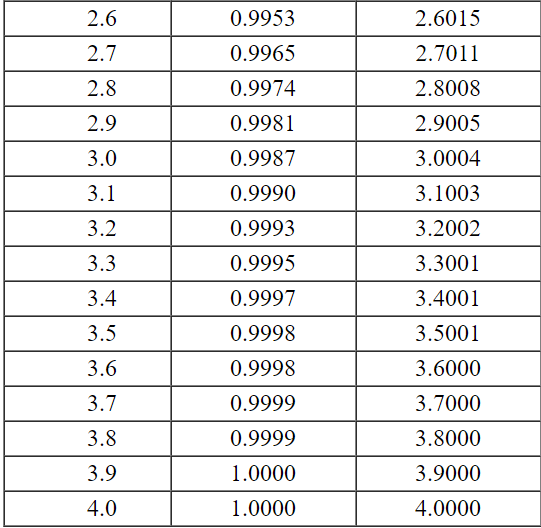
The Distribution , F(Q), and Expected Inventory, I(Q), Functions for the Standard Normal Distribution Function \begin{tabular}{|c|c|c|} \hline-2.2 & 0.0139 & 0.0049 \\ \hline-2.1 & 0.0179 & 0.0065 \\ \hline-2.0 & 0.0228 & 0.0085 \\ \hline-1.9 & 0.0287 & 0.0111 \\ \hline-1.8 & 0.0359 & 0.0143 \\ \hline-1.7 & 0.0446 & 0.0183 \\ \hline-1.6 & 0.0548 & 0.0232 \\ \hline-1.5 & 0.0668 & 0.0293 \\ \hline-1.4 & 0.0808 & 0.0367 \\ \hline-1.3 & 0.0968 & 0.0455 \\ \hline-1.2 & 0.1151 & 0.0561 \\ \hline-1.1 & 0.1357 & 0.0686 \\ \hline-1.0 & 0.1587 & 0.0833 \\ \hline-0.9 & 0.1841 & 0.1004 \\ \hline-0.8 & 0.2119 & 0.1202 \\ \hline-0.7 & 0.2420 & 0.1429 \\ \hline-0.6 & 0.2743 & 0.1687 \\ \hline-0.5 & 0.3085 & 0.1978 \\ \hline-0.4 & 0.3446 & 0.2304 \\ \hline-0.3 & 0.3821 & 0.2668 \\ \hline-0.2 & 0.4207 & 0.3069 \\ \hline-0.1 & 0.4602 & 0.3509 \\ \hline 0.0 & 0.5000 & 0.3989 \\ \hline 0.1 & 0.5398 & 0.4509 \\ \hline \end{tabular} \begin{tabular}{|l|l|l|} \hline 0.2 & 0.5793 & 0.5069 \\ \hline 0.3 & 0.6179 & 0.5668 \\ \hline 0.4 & 0.6554 & 0.6304 \\ \hline 0.5 & 0.6915 & 0.6978 \\ \hline 0.6 & 0.7257 & 0.7687 \\ \hline 0.7 & 0.7580 & 0.8429 \\ \hline 0.8 & 0.7881 & 0.9202 \\ \hline 0.9 & 0.8159 & 1.0004 \\ \hline 1.0 & 0.8413 & 1.0833 \\ \hline 1.1 & 0.8643 & 1.1686 \\ \hline 1.2 & 0.8849 & 1.2561 \\ \hline 1.3 & 0.9032 & 1.3455 \\ \hline 1.4 & 0.9192 & 1.4367 \\ \hline 1.5 & 0.9332 & 1.5293 \\ \hline 1.6 & 0.9452 & 1.6232 \\ \hline 1.7 & 0.9554 & 1.7183 \\ \hline 1.8 & 0.9641 & 1.8143 \\ \hline 1.9 & 0.9713 & 1.9111 \\ \hline 2.0 & 0.9772 & 2.0085 \\ \hline 2.1 & 0.9821 & 2.1065 \\ \hline 2.2 & 0.9861 & 2.2049 \\ \hline 2.3 & 0.9893 & 2.3037 \\ \hline 2.4 & 0.9918 & 2.4027 \\ \hline 2.5 & 0.9938 & 2.5020 \\ \hline \end{tabular} \begin{tabular}{|l|l|l|} \hline 2.6 & 0.9953 & 2.6015 \\ \hline 2.7 & 0.9965 & 2.7011 \\ \hline 2.8 & 0.9974 & 2.8008 \\ \hline 2.9 & 0.9981 & 2.9005 \\ \hline 3.0 & 0.9987 & 3.0004 \\ \hline 3.1 & 0.9990 & 3.1003 \\ \hline 3.2 & 0.9993 & 3.2002 \\ \hline 3.3 & 0.9995 & 3.3001 \\ \hline 3.4 & 0.9997 & 3.4001 \\ \hline 3.5 & 0.9998 & 3.5001 \\ \hline 3.6 & 0.9998 & 3.6000 \\ \hline 3.7 & 0.9999 & 3.7000 \\ \hline 3.8 & 0.9999 & 3.8000 \\ \hline 3.9 & 1.0000 & 3.9000 \\ \hline 4.0 & 1.0000 & 4.0000 \\ \hline \end{tabular} The Distribution , F(Q), and Expected Inventory, I(Q), Functions for the Standard Normal Distribution Function \begin{tabular}{|c|c|c|} \hline-2.2 & 0.0139 & 0.0049 \\ \hline-2.1 & 0.0179 & 0.0065 \\ \hline-2.0 & 0.0228 & 0.0085 \\ \hline-1.9 & 0.0287 & 0.0111 \\ \hline-1.8 & 0.0359 & 0.0143 \\ \hline-1.7 & 0.0446 & 0.0183 \\ \hline-1.6 & 0.0548 & 0.0232 \\ \hline-1.5 & 0.0668 & 0.0293 \\ \hline-1.4 & 0.0808 & 0.0367 \\ \hline-1.3 & 0.0968 & 0.0455 \\ \hline-1.2 & 0.1151 & 0.0561 \\ \hline-1.1 & 0.1357 & 0.0686 \\ \hline-1.0 & 0.1587 & 0.0833 \\ \hline-0.9 & 0.1841 & 0.1004 \\ \hline-0.8 & 0.2119 & 0.1202 \\ \hline-0.7 & 0.2420 & 0.1429 \\ \hline-0.6 & 0.2743 & 0.1687 \\ \hline-0.5 & 0.3085 & 0.1978 \\ \hline-0.4 & 0.3446 & 0.2304 \\ \hline-0.3 & 0.3821 & 0.2668 \\ \hline-0.2 & 0.4207 & 0.3069 \\ \hline-0.1 & 0.4602 & 0.3509 \\ \hline 0.0 & 0.5000 & 0.3989 \\ \hline 0.1 & 0.5398 & 0.4509 \\ \hline \end{tabular} \begin{tabular}{|l|l|l|} \hline 0.2 & 0.5793 & 0.5069 \\ \hline 0.3 & 0.6179 & 0.5668 \\ \hline 0.4 & 0.6554 & 0.6304 \\ \hline 0.5 & 0.6915 & 0.6978 \\ \hline 0.6 & 0.7257 & 0.7687 \\ \hline 0.7 & 0.7580 & 0.8429 \\ \hline 0.8 & 0.7881 & 0.9202 \\ \hline 0.9 & 0.8159 & 1.0004 \\ \hline 1.0 & 0.8413 & 1.0833 \\ \hline 1.1 & 0.8643 & 1.1686 \\ \hline 1.2 & 0.8849 & 1.2561 \\ \hline 1.3 & 0.9032 & 1.3455 \\ \hline 1.4 & 0.9192 & 1.4367 \\ \hline 1.5 & 0.9332 & 1.5293 \\ \hline 1.6 & 0.9452 & 1.6232 \\ \hline 1.7 & 0.9554 & 1.7183 \\ \hline 1.8 & 0.9641 & 1.8143 \\ \hline 1.9 & 0.9713 & 1.9111 \\ \hline 2.0 & 0.9772 & 2.0085 \\ \hline 2.1 & 0.9821 & 2.1065 \\ \hline 2.2 & 0.9861 & 2.2049 \\ \hline 2.3 & 0.9893 & 2.3037 \\ \hline 2.4 & 0.9918 & 2.4027 \\ \hline 2.5 & 0.9938 & 2.5020 \\ \hline \end{tabular} \begin{tabular}{|l|l|l|} \hline 2.6 & 0.9953 & 2.6015 \\ \hline 2.7 & 0.9965 & 2.7011 \\ \hline 2.8 & 0.9974 & 2.8008 \\ \hline 2.9 & 0.9981 & 2.9005 \\ \hline 3.0 & 0.9987 & 3.0004 \\ \hline 3.1 & 0.9990 & 3.1003 \\ \hline 3.2 & 0.9993 & 3.2002 \\ \hline 3.3 & 0.9995 & 3.3001 \\ \hline 3.4 & 0.9997 & 3.4001 \\ \hline 3.5 & 0.9998 & 3.5001 \\ \hline 3.6 & 0.9998 & 3.6000 \\ \hline 3.7 & 0.9999 & 3.7000 \\ \hline 3.8 & 0.9999 & 3.8000 \\ \hline 3.9 & 1.0000 & 3.9000 \\ \hline 4.0 & 1.0000 & 4.0000 \\ \hline \end{tabular}
Step by Step Solution
There are 3 Steps involved in it

Get step-by-step solutions from verified subject matter experts