

Question: The following two tables are from an Excel spreadsheet for a Transportation Problem with 4 origins (Galena, Helena, Lima and Miami) and 4 destinations (Atlanta,
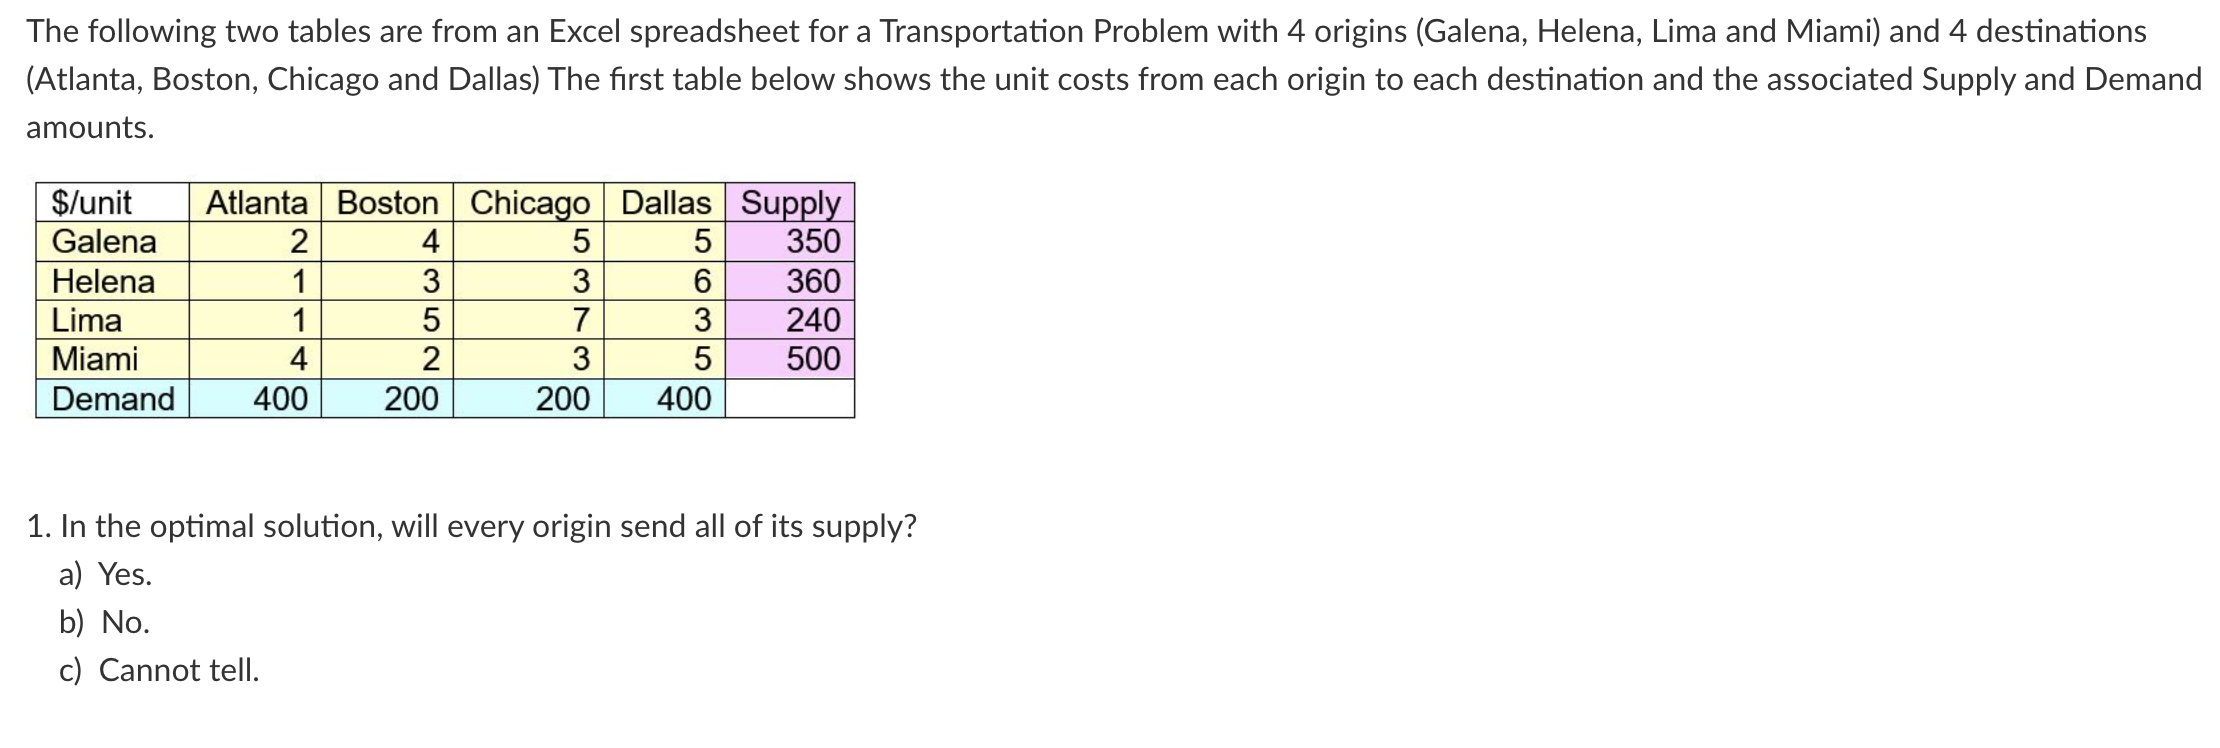
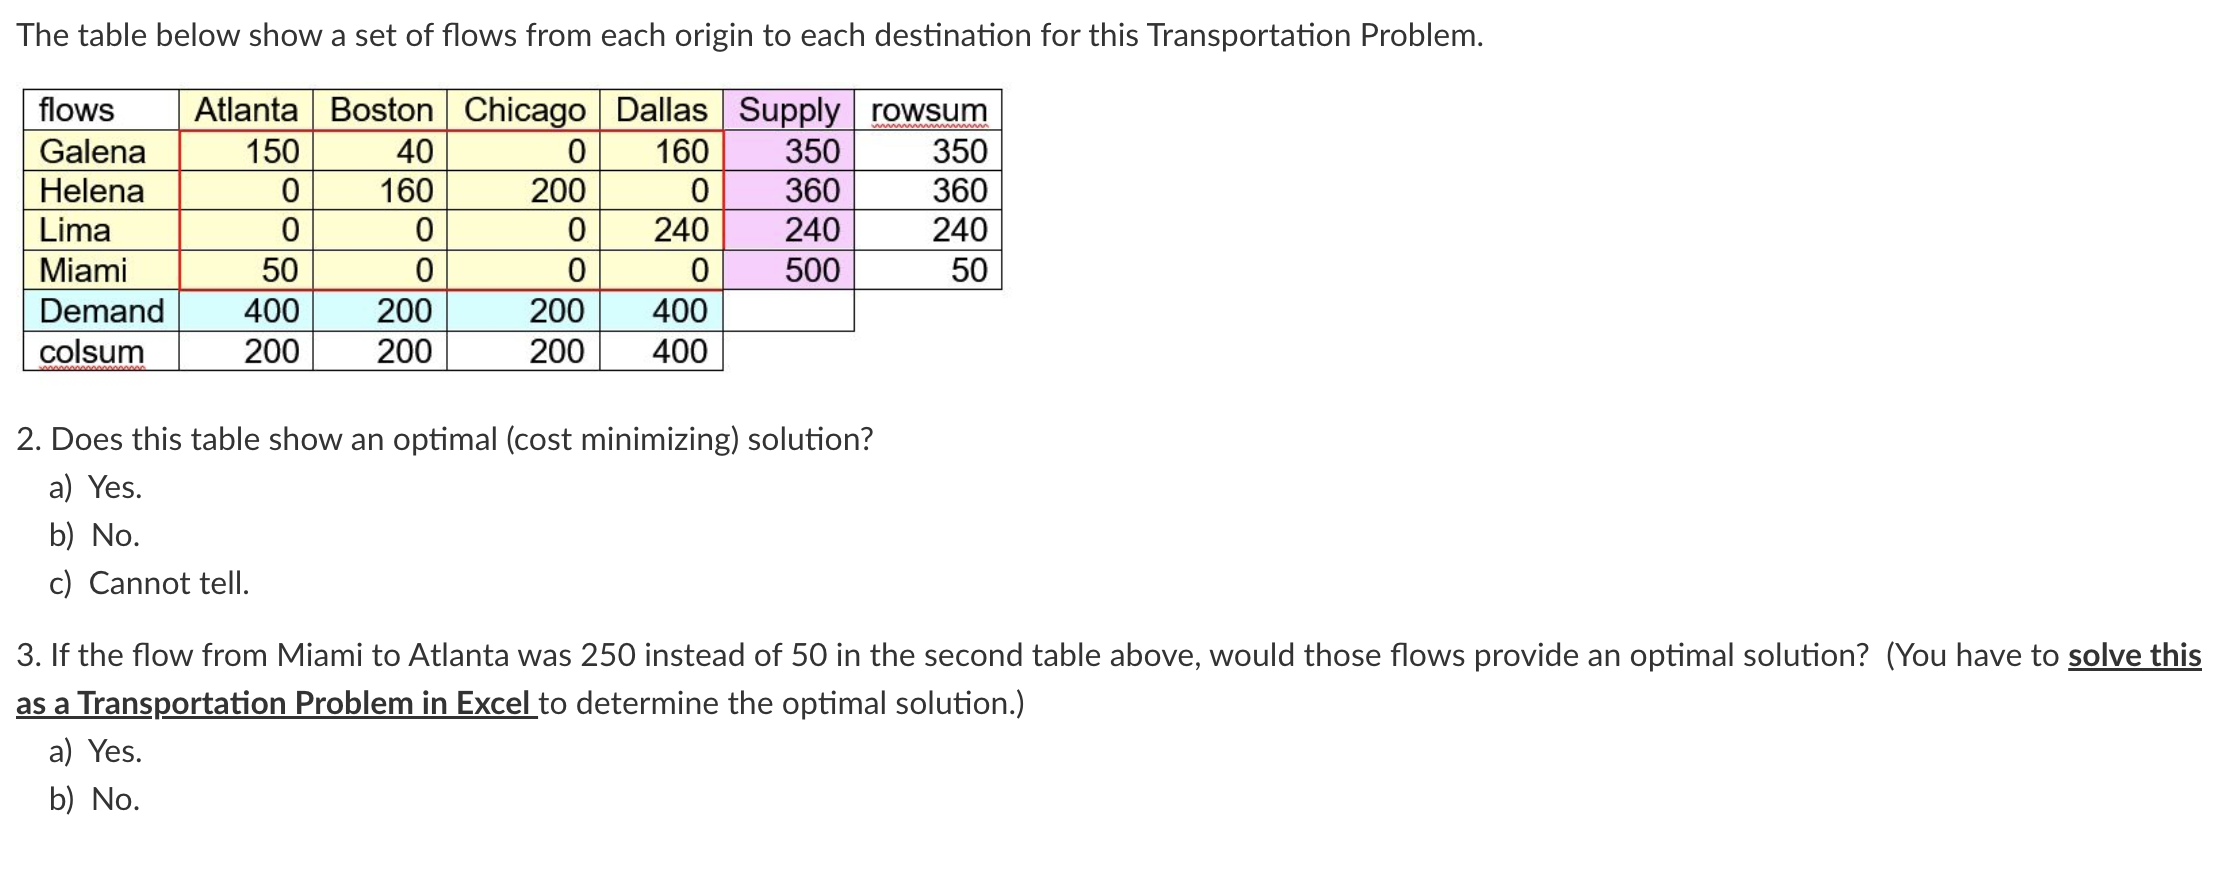
The following two tables are from an Excel spreadsheet for a Transportation Problem with 4 origins (Galena, Helena, Lima and Miami) and 4 destinations (Atlanta, Boston, Chicago and Dallas) The first table below shows the unit costs from each origin to each destination and the associated Supply and Demand amounts. 1. In the optimal solution, will every origin send all of its supply? a) Yes. b) No. c) Cannot tell. 2. Does this table show an optimal (cost minimizing) solution? a) Yes. b) No. c) Cannot tell. 3. If the flow from Miami to Atlanta was 250 instead of 50 in the second table above, would those flows provide an optimal solution? (You have to solve this as a Transportation Problem in Excel to determine the optimal solution.) a) Yes. b) No
Step by Step Solution
There are 3 Steps involved in it

Get step-by-step solutions from verified subject matter experts