Question: The following Value Stream Map (VSM) represents the current situation of a company that wants to adopt lean principles. The VSM is generated after a

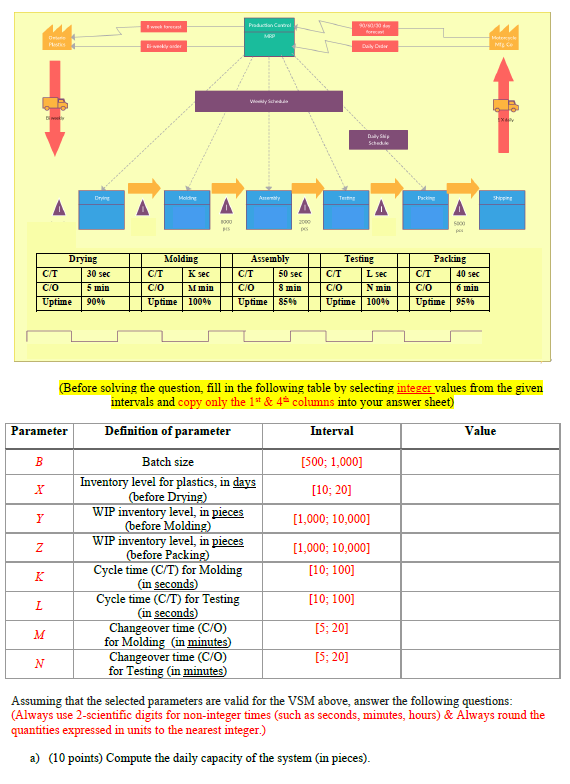
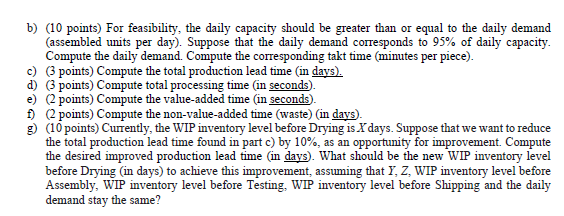
The following Value Stream Map (VSM) represents the current situation of a company that wants to adopt lean principles. The VSM is generated after a period of observation during which cycle times (C/T) are measured. The main processes are Drying, Molding, Assembly, Testing, Packing and Shipping. Around these are the inventory triangles with the associated inventory levels (this may be a snapshot or may include a statistical distribution). In the VSM below, some parts are empty on purpose since you will select the related parameters and make necessary computations. Assume that the company works 3 shifts/day, 8 hours/shift with a one-hour lunch break in a shift. Pradicional Daily Code MIL Schwa Schedule Drying Molding Annely Test Shippine A A A A 1000 Drying C/T 30 sec C/O 5 min Uptime 90% Molding C/T K sec C/O Mmin Uptime 100% Assembly C/T 50 sec C/O 8 min Uptime 8595 Testing C/T L sec C/O N min Uptime 100% Packing C/T 40 sec C/O 6 min Uptime 9596 (Before solving the question, fill in the following table by selecting integer values from the given intervals and copy only the 1* & 4 columns into your answer sheet) Parameter Definition of parameter Interval Value B Batch size (500; 1,000] Inventory level for plastics, in days X (before Drying) [10:20] WIP inventory level, in pieces Y [1,000; 10,000] (before Molding) WIP inventory level, in pieces Z (before Packing) [1,000; 10,000) Cycle time (C/T) for Molding [10; 100) (in seconds) L [10; 100) Cycle time (C/T) for Testing (in seconds) M Changeover time (C/O) [5:20] for Molding (in minutes) N [5:20] Changeover time (C/O) for Testing (in minutes) Assuming that the selected parameters are valid for the VSM above, answer the following questions: (Always use 2-scientific digits for non-integer times (such as seconds, minutes, hours) & Always round the quantities expressed in units to the nearest integer.) a) (10 points) Compute the daily capacity of the system (in pieces). b) (10 points) For feasibility, the daily capacity should be greater than or equal to the daily demand (assembled units per day). Suppose that the daily demand corresponds to 95% of daily capacity. Compute the daily demand. Compute the corresponding takt time (minutes per piece). c) 3 points) Compute the total production lead time (in days). d) 3 points) Compute total processing time in seconds) e) points) Compute the value-added time in seconds f) 2 points) Compute the non-value-added time (waste) (in days) g) (10 points) Currently, the WIP inventory level before Drying is X days. Suppose that we want to reduce the total production lead time found in part c) by 10%, as an opportunity for improvement. Compute the desired improved production lead time in days). What should be the new WIP inventory level before Drying (in days) to achieve this improvement, assuming that Y, Z, WIP inventory level before Assembly, WIP inventory level before Testing, WIP inventory level before Shipping and the daily demand stay the same? The following Value Stream Map (VSM) represents the current situation of a company that wants to adopt lean principles. The VSM is generated after a period of observation during which cycle times (C/T) are measured. The main processes are Drying, Molding, Assembly, Testing, Packing and Shipping. Around these are the inventory triangles with the associated inventory levels (this may be a snapshot or may include a statistical distribution). In the VSM below, some parts are empty on purpose since you will select the related parameters and make necessary computations. Assume that the company works 3 shifts/day, 8 hours/shift with a one-hour lunch break in a shift. Pradicional Daily Code MIL Schwa Schedule Drying Molding Annely Test Shippine A A A A 1000 Drying C/T 30 sec C/O 5 min Uptime 90% Molding C/T K sec C/O Mmin Uptime 100% Assembly C/T 50 sec C/O 8 min Uptime 8595 Testing C/T L sec C/O N min Uptime 100% Packing C/T 40 sec C/O 6 min Uptime 9596 (Before solving the question, fill in the following table by selecting integer values from the given intervals and copy only the 1* & 4 columns into your answer sheet) Parameter Definition of parameter Interval Value B Batch size (500; 1,000] Inventory level for plastics, in days X (before Drying) [10:20] WIP inventory level, in pieces Y [1,000; 10,000] (before Molding) WIP inventory level, in pieces Z (before Packing) [1,000; 10,000) Cycle time (C/T) for Molding [10; 100) (in seconds) L [10; 100) Cycle time (C/T) for Testing (in seconds) M Changeover time (C/O) [5:20] for Molding (in minutes) N [5:20] Changeover time (C/O) for Testing (in minutes) Assuming that the selected parameters are valid for the VSM above, answer the following questions: (Always use 2-scientific digits for non-integer times (such as seconds, minutes, hours) & Always round the quantities expressed in units to the nearest integer.) a) (10 points) Compute the daily capacity of the system (in pieces). b) (10 points) For feasibility, the daily capacity should be greater than or equal to the daily demand (assembled units per day). Suppose that the daily demand corresponds to 95% of daily capacity. Compute the daily demand. Compute the corresponding takt time (minutes per piece). c) 3 points) Compute the total production lead time (in days). d) 3 points) Compute total processing time in seconds) e) points) Compute the value-added time in seconds f) 2 points) Compute the non-value-added time (waste) (in days) g) (10 points) Currently, the WIP inventory level before Drying is X days. Suppose that we want to reduce the total production lead time found in part c) by 10%, as an opportunity for improvement. Compute the desired improved production lead time in days). What should be the new WIP inventory level before Drying (in days) to achieve this improvement, assuming that Y, Z, WIP inventory level before Assembly, WIP inventory level before Testing, WIP inventory level before Shipping and the daily demand stay the same


