

Question: The frequency table shown above shows ages from a random sample of 50 people. a. How many people are between 25 and 31 years of
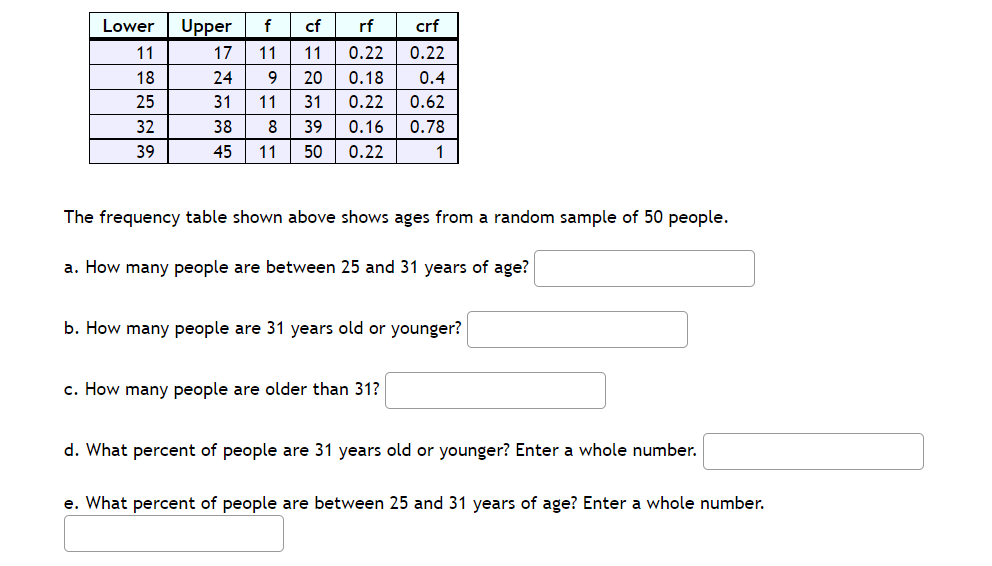
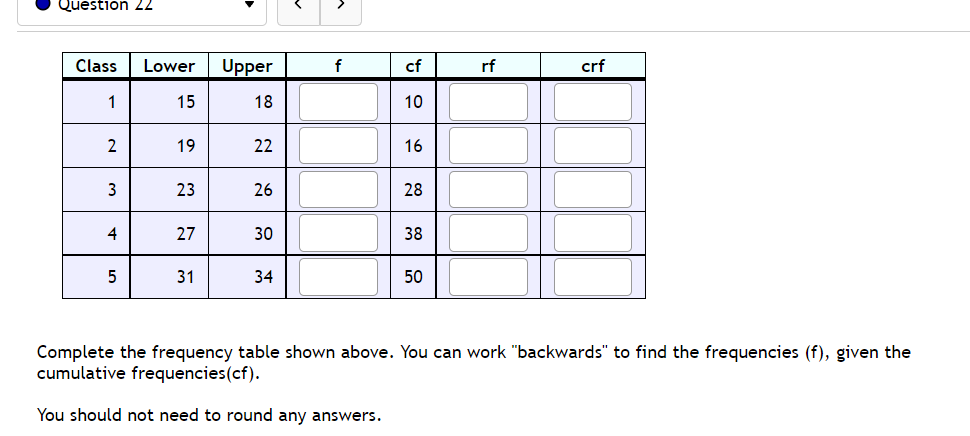
The frequency table shown above shows ages from a random sample of 50 people. a. How many people are between 25 and 31 years of age?[ ' b. How many people are 31 years old or younger? ' ] o. How many people are older than 31? l l d. What percent of people are 31 years old or younger? Enter a whole number. :] e. What percent of people are between 25 and 31 years of age? Enter a whole number. :] Question 22 Class Lower Upper f cf rf crf 15 18 10 2 19 22 16 3 23 26 28 4 27 30 38 5 31 34 50 Complete the frequency table shown above. You can work "backwards" to find the frequencies (f), given the cumulative frequencies(cf). You should not need to round any answers
Step by Step Solution
There are 3 Steps involved in it

Get step-by-step solutions from verified subject matter experts