

Question: The function that approximates the data given in the table and graph is y = 3 sin [21:{x801f365] + 12.1, where y gives the number
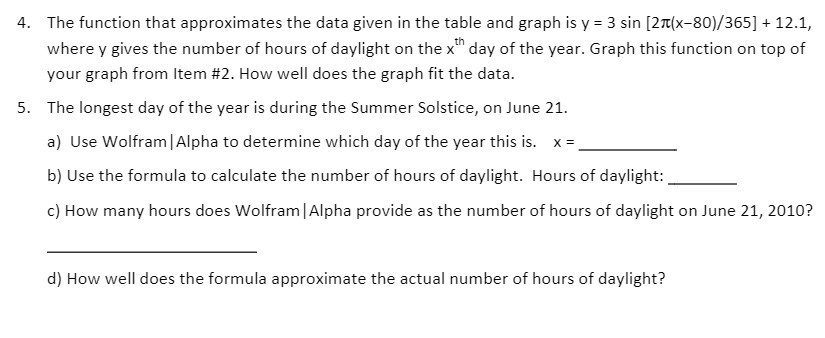
The function that approximates the data given in the table and graph is y = 3 sin [21":{x801f365] + 12.1, where y gives the number of hours of daylight on the with day of the year. Graph this function on top of your graph from Item #2. How well does the graph fit the data. The longest day of the year is during the Summer Solstice, on June 21. a] Use Wolfram [Alpha to determine which day of the year this is. x = b] Use the formula to calculate the number of hours of daylight. Hours of daylight: c] Hovlr many hours does Wolfram IAlpha provide as the number of hours of daylight on June 21, 2010? d) How well does the formula approximate the actual number of hours of daylight
Step by Step Solution
There are 3 Steps involved in it

Get step-by-step solutions from verified subject matter experts