

Question: The function y = f (x ) is graphed below. Plot a line segment connecting the points on f where x = -5 and x

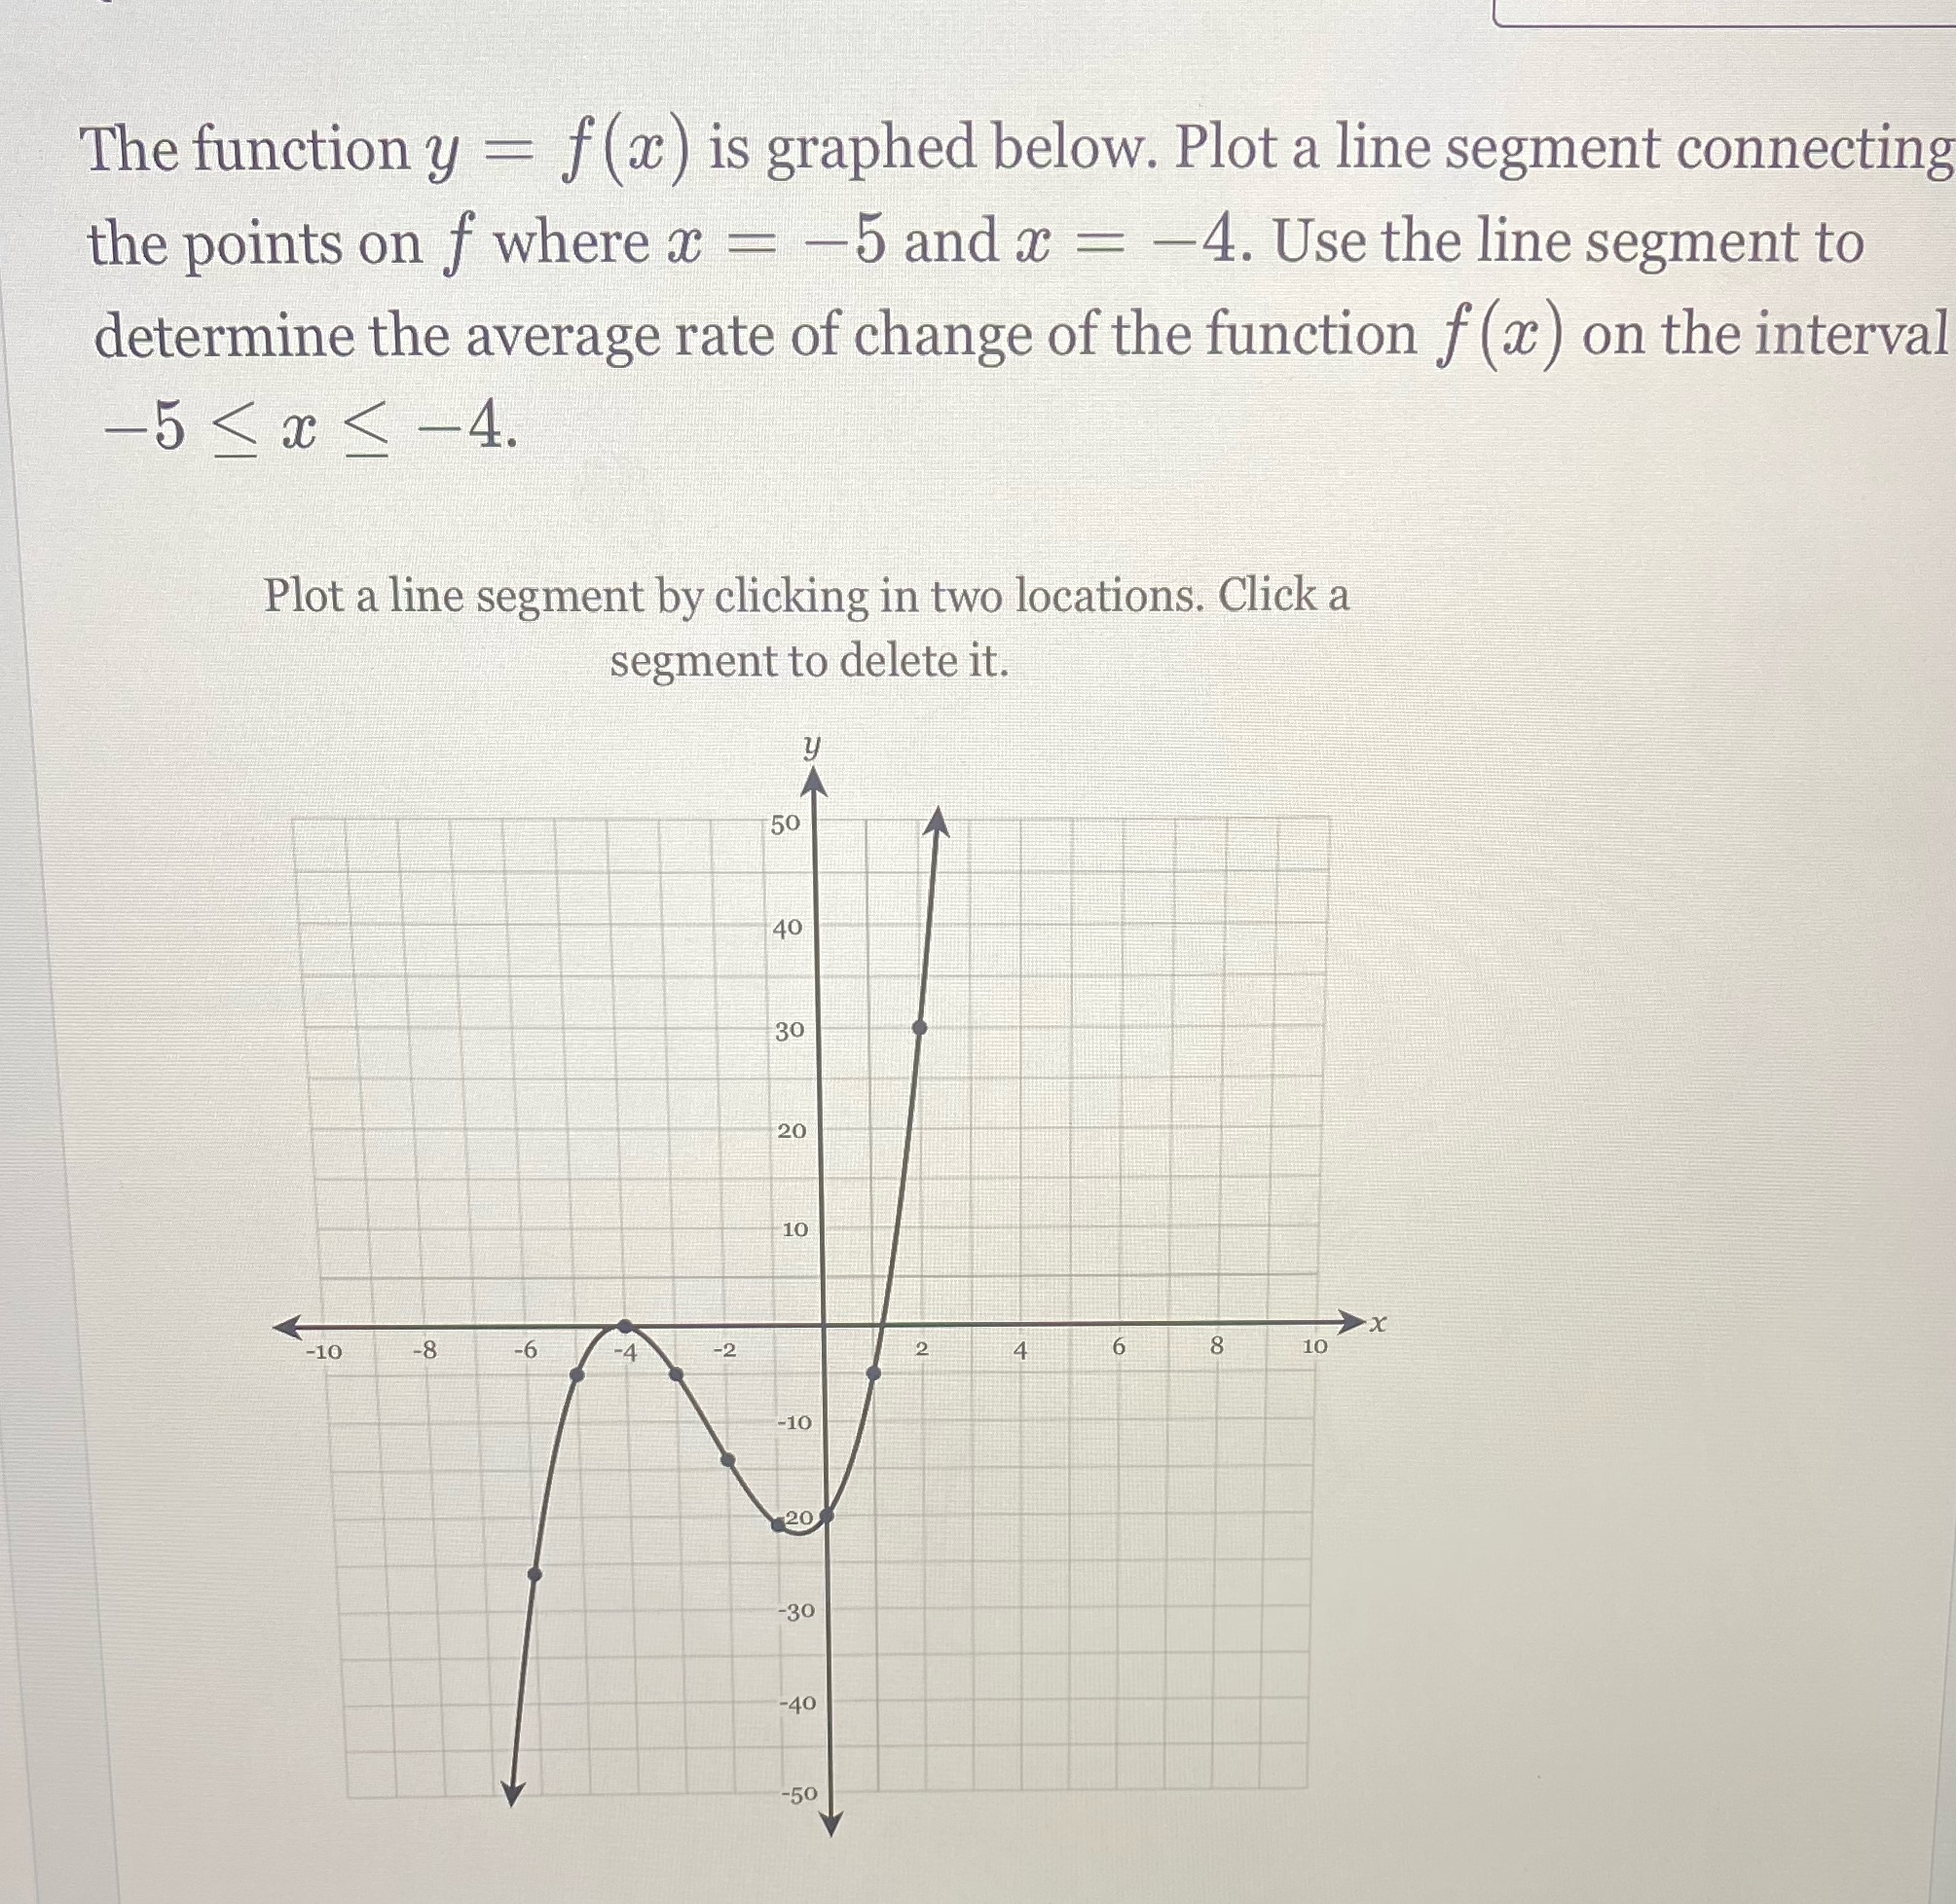
The function y = f (x ) is graphed below. Plot a line segment connecting the points on f where x = -5 and x = -4. Use the line segment to determine the average rate of change of the function f (x) on the interval -5
Step by Step Solution
There are 3 Steps involved in it
1 Expert Approved Answer
Step: 1 Unlock

Question Has Been Solved by an Expert!
Get step-by-step solutions from verified subject matter experts
Step: 2 Unlock
Step: 3 Unlock