

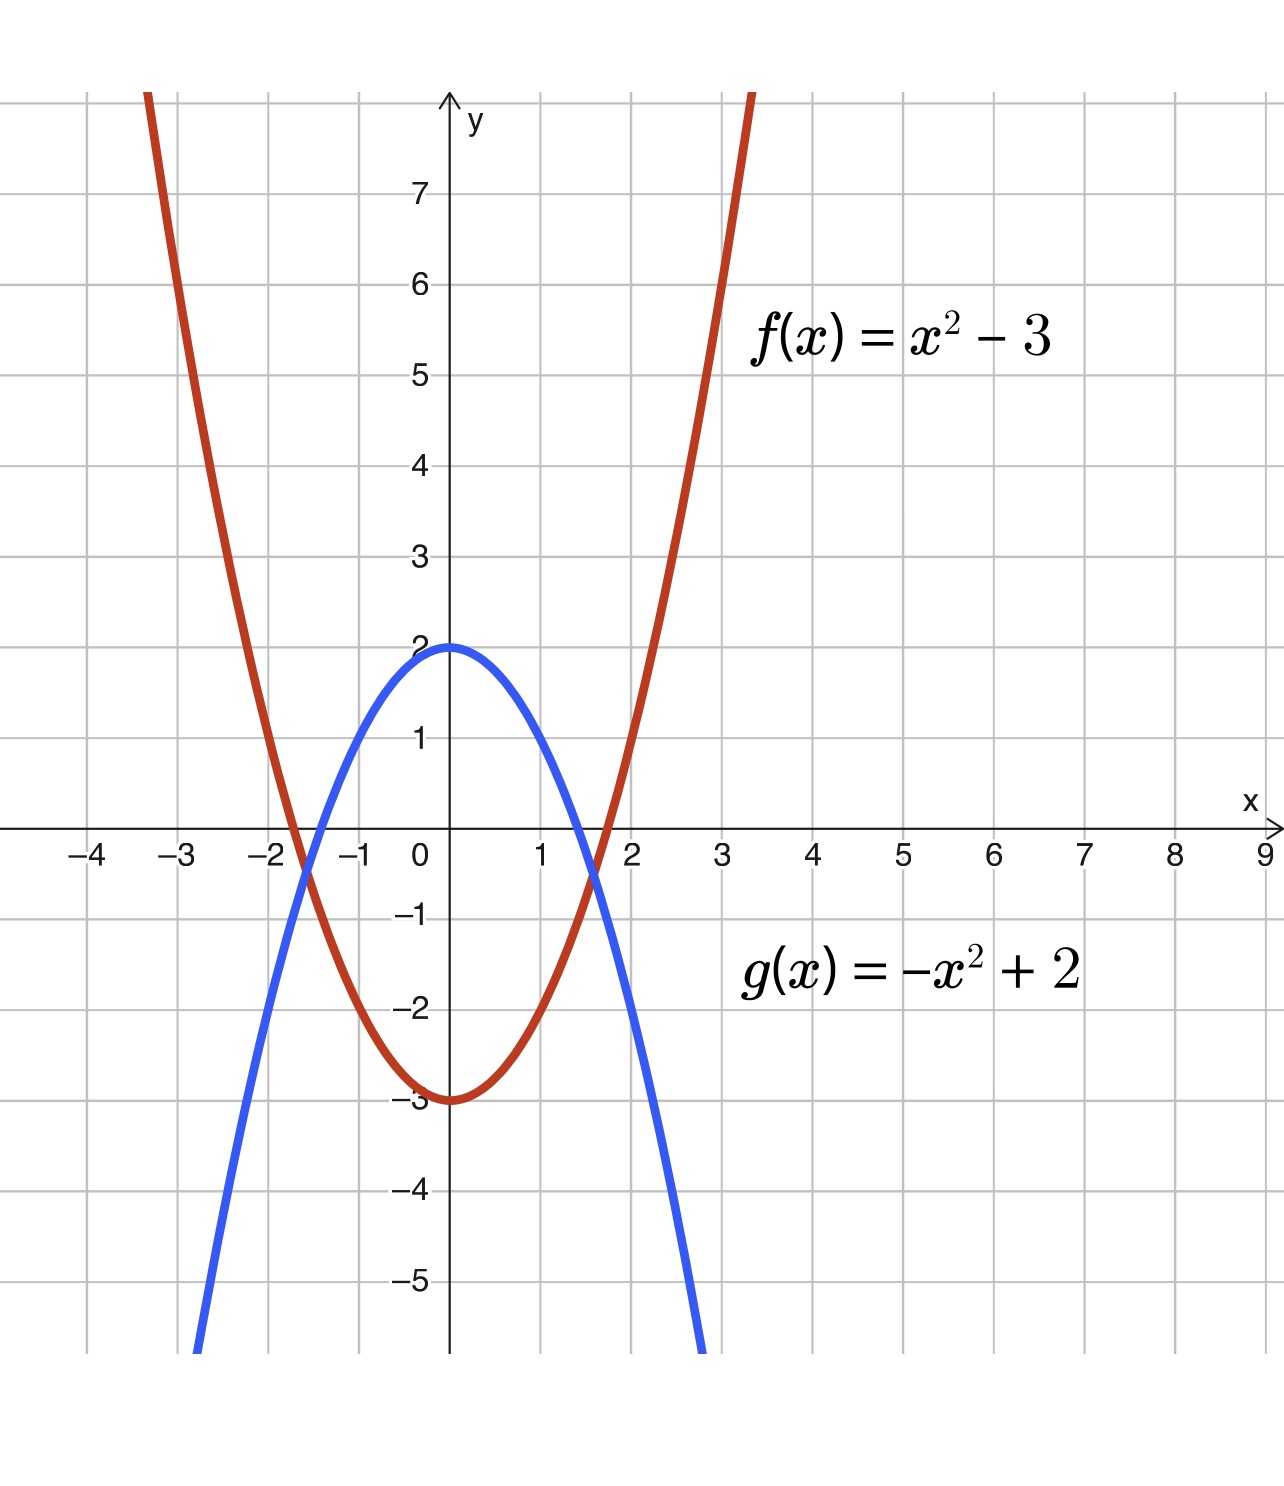
Question: The functions f(x) = x2 - 3 and g(x) = -x2 + 2 are shown on the graph. The graph shows f of x equals
The functions f(x) = x2 - 3 and g(x) = -x2 + 2 are shown on the graph. The graph shows f of x equals x squared minus 3, which is an upward opening parabola with a vertex at 0 comma negative 3 and a point at negative 1 comma negative 2 and a point at 1 comma negative 2. The graph also shows g of x, which is a downward opening parabola with a vertex at 0 comma 2 and a point at negative 1 comma 1 and a point at 1 comma 1. Explain how to modify the graphs of f(x) and g(x) to graph the solution set to the following system of inequalities. How can the solution set be identified? y ? x2 - 3 y > -x2 + 2
\f
Step by Step Solution
There are 3 Steps involved in it
1 Expert Approved Answer
Step: 1 Unlock

Question Has Been Solved by an Expert!
Get step-by-step solutions from verified subject matter experts
Step: 2 Unlock
Step: 3 Unlock