

Question: The given data set represents the relationship between the national unemployment rate for adult males versus adult females. at = national unemployment ratiaforaduft X 7
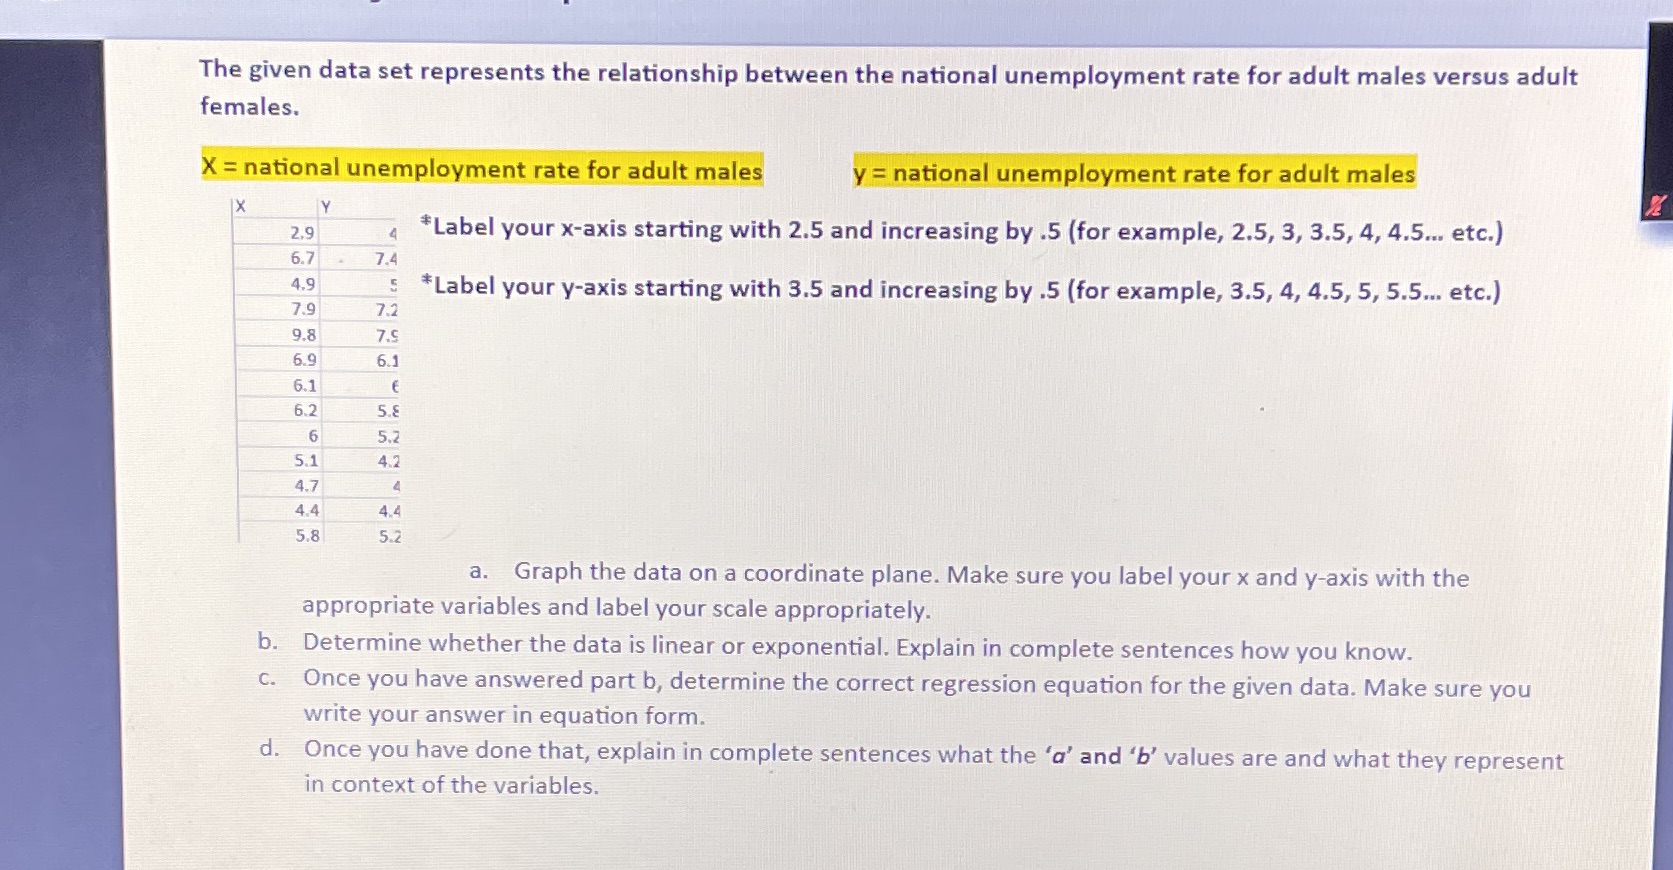

The given data set represents the relationship between the national unemployment rate for adult males versus adult females. at = national unemployment ratiaforaduft X 7 2,9; 6.7 '1' 4.9__ 7.9 9.8 5.9: 6.1 5.2 6 5.1 4.7 4.4 5.8 a 7.4 7.2 7.5 6.! E "5.: ____5.1 4.2 I 4.4 5.2 thawwml mete.- armieeenalyeemplmm rat'iiiaiilmili *Label your xaxis starting with 2.5 and increasing by .5 (for example, 2.5, 3, 3.5, 4, 4.5... etc.) 'Label your y-axis starting with 3.5 and increasing by .5 (for example, 3.5, 4, 4.5, 5, 5.5... etc.) a. Graph the data on a coordinate plane. Make sure you label your 3: and yaxis with the appropriate variables and label your scale appropriately. Determine whether the data is linear or exponential. Explain in complete sentences how you know. Once you have answered part 1), determine the correct regression equation for the given data. Make sure you write your answer in equation form. Once you have done that, explain in complete sentences what the 'o' and 13' values are and what they represent in context ofthevariables
Step by Step Solution
There are 3 Steps involved in it

Get step-by-step solutions from verified subject matter experts