

Question: The given graph/data I, II, III and IV represent general trends observed for different physisorption and chemisorption processes under mild conditions of temperature and pressure.
The given graph/data I, II, III and IV represent general trends observed for different physisorption and chemisorption processes under mild conditions of temperature and pressure. Which of the following choice(s) about I, II, III and IV is (are) correct?
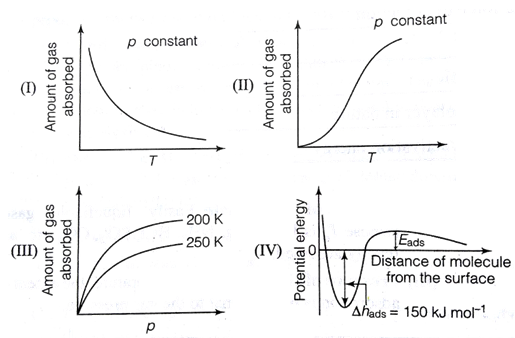
(A) I is physisorption and II is chemisorption
(B) I is physisorption and III is chemisorption
(C) IV is chemisorption and II is chemisorption
(D) IV is chemisorption and III is chemisorption
(III) Amount of gas absorbed p constant T 200 K 250 K -A (IV) Potential energy p constant T Eads Distance of molecule from the surface Ahads 150 kJ mol-
Step by Step Solution
3.35 Rating (142 Votes )
There are 3 Steps involved in it
The detailed answer for the above question is provided below Ph... View full answer

Get step-by-step solutions from verified subject matter experts