

Question: The given scatter plot shows x = age versus y data on a test: =test score a) Determine the equation of the approximate line
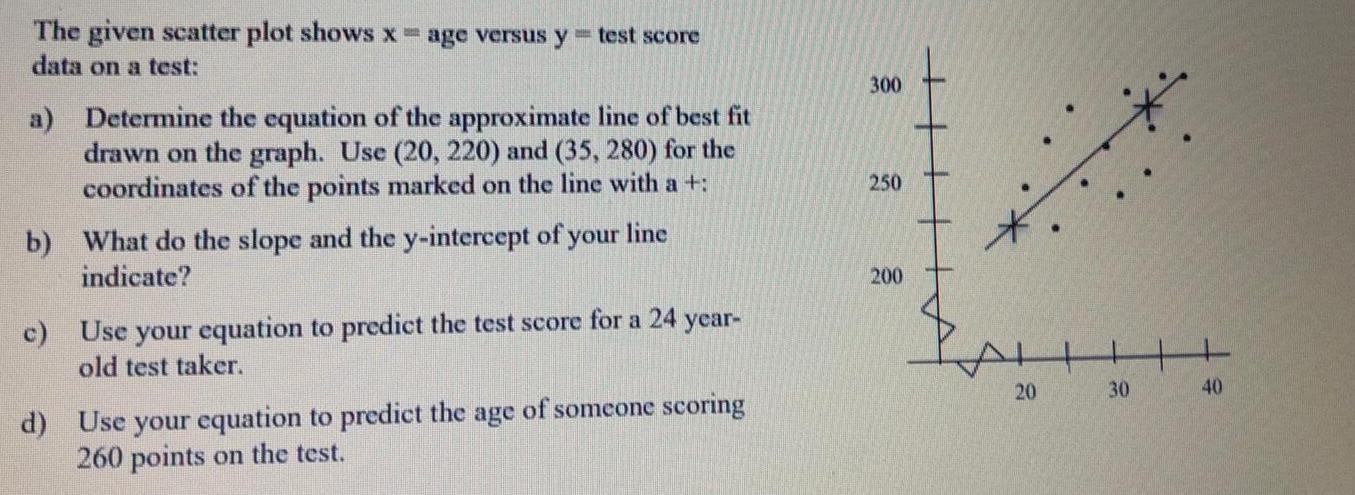
The given scatter plot shows x = age versus y data on a test: =test score a) Determine the equation of the approximate line of best fit drawn on the graph. Use (20, 220) and (35, 280) for the coordinates of the points marked on the line with a +: your b) What do the slope and the y-intercept of line indicate? c) Use your equation to predict the test score for a 24 old test taker. 300 250 200 year- d) Use your equation to predict the age of someone scoring 260 points on the test. 20 30 40
Step by Step Solution
There are 3 Steps involved in it
1 Expert Approved Answer
Step: 1 Unlock

Question Has Been Solved by an Expert!
Get step-by-step solutions from verified subject matter experts
Step: 2 Unlock
Step: 3 Unlock