

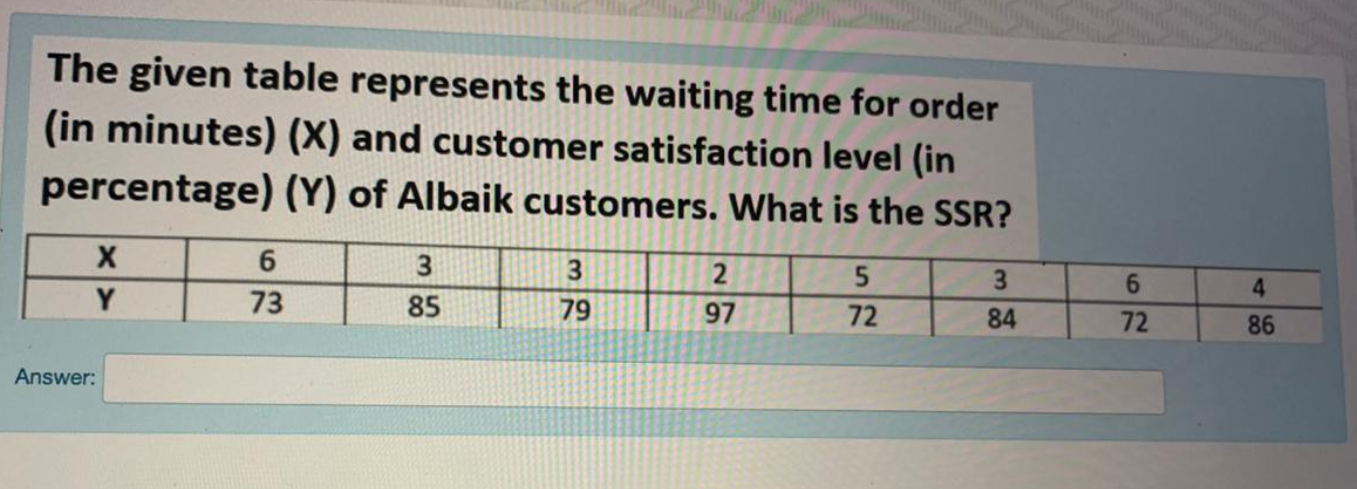
Question: The given table represents the waiting time for order (in minutes) (x) and customer satisfaction level (in percentage) (Y) of Albaik customers. What is the
Step by Step Solution
There are 3 Steps involved in it
1 Expert Approved Answer
Step: 1 Unlock

To calculate the SSR Sum of Squares due to Regression from a given data set we need to first compute ... View full answer
Question Has Been Solved by an Expert!
Get step-by-step solutions from verified subject matter experts
Step: 2 Unlock
Step: 3 Unlock