

Question: The goal is to use the result and make basic conclusions about the network (Comcast) performance over the two hour period captured by the experiment.
The goal is to use the result and make basic conclusions about the network (Comcast) performance over the two hour period captured by the experiment. It is also an exercise in dealing with raw data. Analyze the results( https://www.cs.unh.edu/~cs725/assignments/a3/cs725-f18-a3-pings.txt) and answer the following questions:
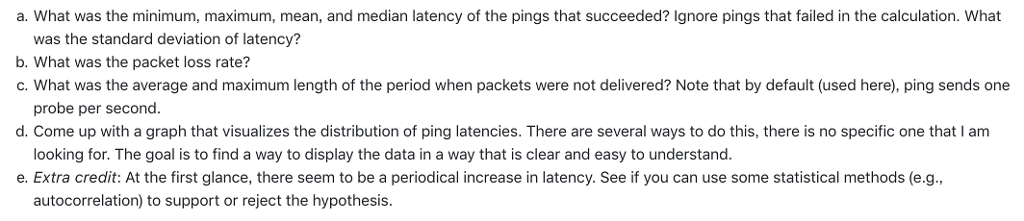
a. What was the minimum, maximum, mean, and median latency of the pings that succeeded? Ignore pings that failed in the calculation. What was the standard deviation of latency? b. What was the packet loss rate? C. What was the average and maximum length of the period when packets were not delivered? Note that by default (used here), ping sends one d. Come up with a graph that visualizes the distribution of ping latencies. There are several ways to do this, there is no specific one that I am e. Extra credit: At the first glance, there seem to be a periodical increase in latency. See if you can use some statistical methods (e.g., probe per second. looking for. The goal is to find a way to display the data in a way that is clear and easy to understand autocorrelation) to support or reject the hypothesis. a. What was the minimum, maximum, mean, and median latency of the pings that succeeded? Ignore pings that failed in the calculation. What was the standard deviation of latency? b. What was the packet loss rate? C. What was the average and maximum length of the period when packets were not delivered? Note that by default (used here), ping sends one d. Come up with a graph that visualizes the distribution of ping latencies. There are several ways to do this, there is no specific one that I am e. Extra credit: At the first glance, there seem to be a periodical increase in latency. See if you can use some statistical methods (e.g., probe per second. looking for. The goal is to find a way to display the data in a way that is clear and easy to understand autocorrelation) to support or reject the hypothesis
Step by Step Solution
There are 3 Steps involved in it

Get step-by-step solutions from verified subject matter experts