

Question: The goal is to write a complete C++ program to analyze monthly rainfall data. The data we'll use is from Chicago's Midway airport, but
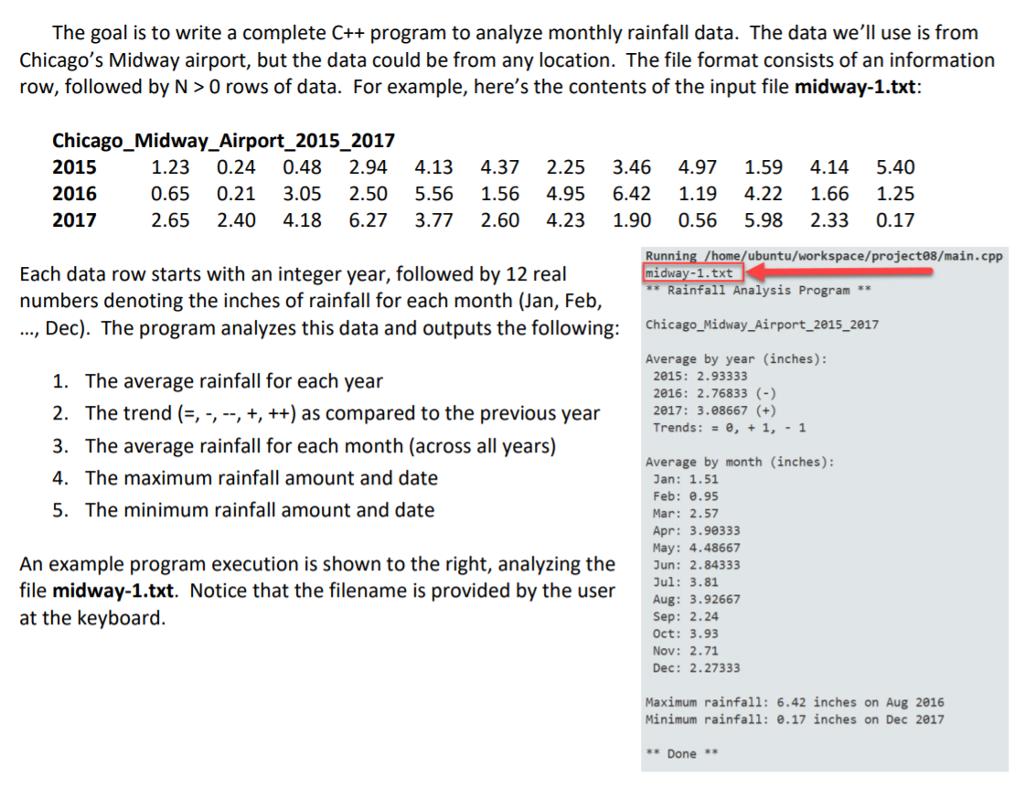
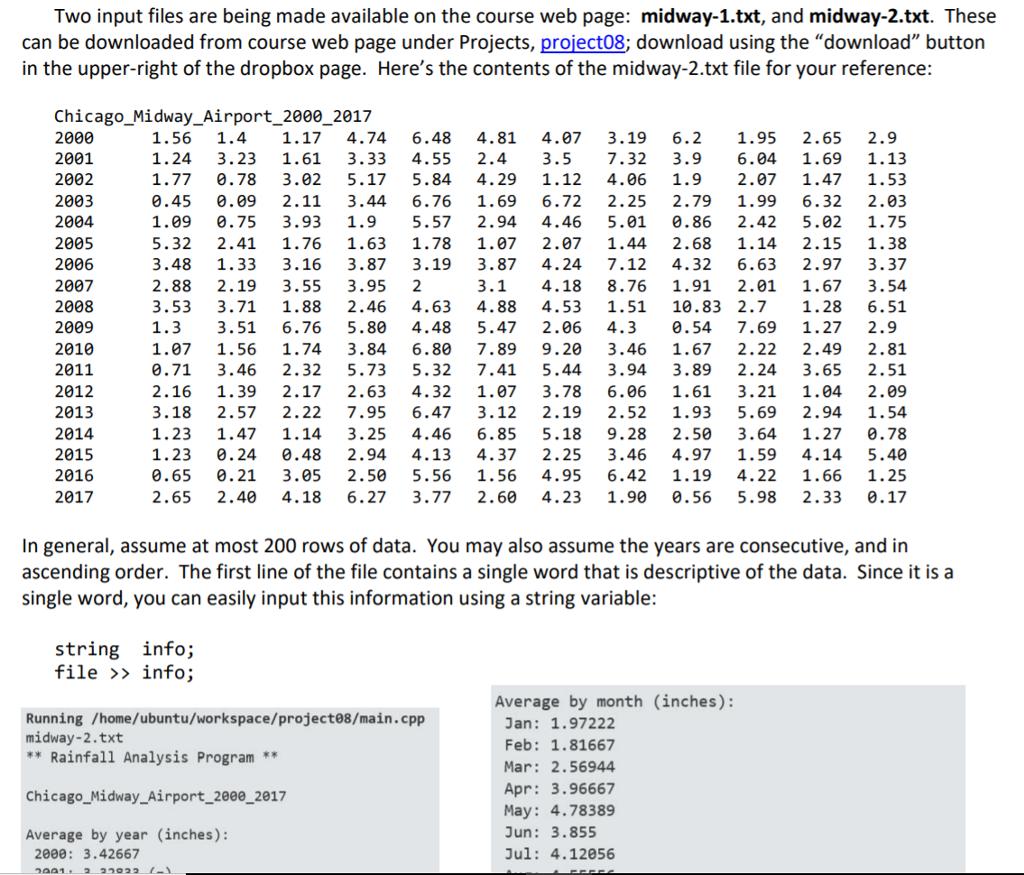
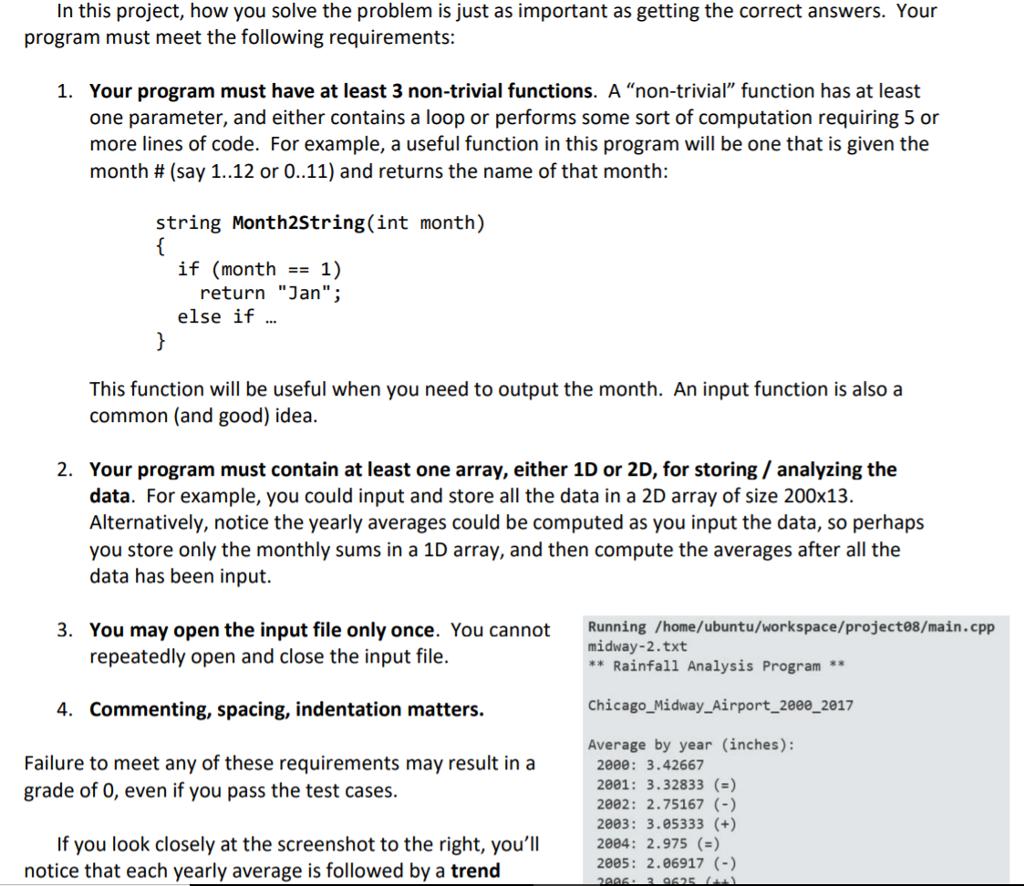
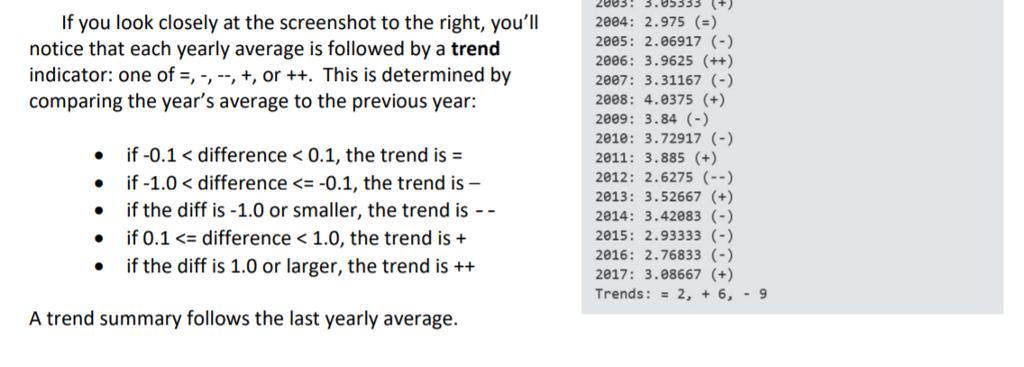
The goal is to write a complete C++ program to analyze monthly rainfall data. The data we'll use is from Chicago's Midway airport, but the data could be from any location. The file format consists of an information row, followed by N> 0 rows of data. For example, here's the contents of the input file midway-1.txt: Chicago Midway_Airport_2015_2017 2015 2016 2017 .... 1.23 0.24 0.48 2.94 4.13 4.37 2.25 3.46 4.97 1.59 4.14 5.40 0.65 0.21 3.05 2.50 5.56 1.56 4.95 6.42 1.19 4.22 1.66 2.65 2.40 4.18 6.27 3.77 2.60 4.23 1.90 0.56 5.98 2.33 0.17 1.25 Each data row starts with an integer year, followed by 12 real numbers denoting the inches of rainfall for each month (Jan, Feb, Dec). The program analyzes this data and outputs the following: 1. The average rainfall for each year 2. The trend (=, -, --, +, ++) as compared to the previous year 3. The average rainfall for each month (across all years) 4. The maximum rainfall amount and date 5. The minimum rainfall amount and date An example program execution is shown to the right, analyzing the file midway-1.txt. Notice that the filename is provided by the user at the keyboard. Running /home/ubuntu/workspace/project88/main.cpp midway-1.txt ** Rainfall Analysis Program ** Chicago Midway Airport_2015_2017 Average by year (inches): 2015: 2.93333 2016: 2.76833 (-) 2017: 3.08667 (+) Trends: = 0, +1, 1 Average by month (inches): Jan: 1.51 Feb: 0.95 Mar: 2.57 Apr: 3.90333 May: 4.48667 Jun: 2.84333 Jul: 3.81 Aug: 3.92667 Sep: 2.24 Oct: 3.93 Nov: 2.71 Dec: 2.27333 Maximum rainfall: 6.42 inches on Aug 2016 Minimum rainfall: 0.17 inches on Dec 2017 ** Done ** Two input files are being made available on the course web page: midway-1.txt, and midway-2.txt. These can be downloaded from course web page under Projects, project08; download using the "download" button in the upper-right of the dropbox page. Here's the contents of the midway-2.txt file for your reference: Chicago Midway_Airport_2000_2017 2000 1.4 2001 2002 2003 2004 2005 2006 2007 2008 2009 2010 2011 2012 2013 2014 2015 2016 2017 1.56 1.17 4.74 6.48 4.81 4.07 3.19 6.2 1.95 2.65 2.9 1.24 3.23 1.61 3.33 4.55 2.4 3.5 7.32 3.9 6.04 1.69 1.13 1.77 0.78 3.02 5.17 5.84 4.29 1.12 4.06 1.9 2.07 1.47 1.53 0.45 0.09 2.11 3.44 6.76 1.69 6.72 2.25 2.79 1.99 6.32 2.03 1.09 0.75 3.93 1.9 5.57 2.94 4.46 5.01 0.86 2.42 5.02 1.75 5.32 2.41 1.76 1.63 1.78 1.07 2.07 1.44 2.68 3.16 3.87 3.19 3.87 4.24 7.12 4.32 6.63 2.19 3.55 2 3.1 4.18 8.76 1.91 2.01 4.63 4.88 4.53 1.51 10.83 2.7 4.48 5.47 2.06 4.3 0.54 7.69 1.14 2.15 1.38 3.48 1.33 2.97 3.37 2.88 1.67 3.54 3.95 2.46 3.53 3.71 1.88 1.28 6.51 1.3 3.51 6.76 1.27 2.9 1.07 1.56 2.81 5.80 1.74 3.84 6.80 7.89 9.20 3.46 1.67 2.22 2.49 0.71 3.46 2.32 5.73 5.32 7.41 5.44 3.94 3.89 2.24 3.65 2.51 2.16 1.39 2.17 2.63 4.32 1.07 3.78 6.06 1.61 3.21 1.04 2.09 3.18 2.57 2.22 7.95 6.47 3.12 2.19 2.52 1.93 5.69 2.94 1.54 1.23 1.47 1.14 3.25 4.46 6.85 9.28 2.50 3.64 1.27 0.78 1.23 0.24 0.48 2.94 4.13 4.37 2.25 3.46 4.97 1.59 4.14 5.40 0.65 0.21 3.05 2.50 5.56 1.56 4.95 6.42 1.19 4.22 1.66 1.25 2.65 2.40 4.18 6.27 3.77 2.60 4.23 1.90 0.56 5.98 2.33 0.17 5.18 In general, assume at most 200 rows of data. You may also assume the years are consecutive, and in ascending order. The first line of the file contains a single word that is descriptive of the data. Since it is a single word, you can easily input this information using a string variable: string info; file >> info; Running /home/ubuntu/workspace/project08/main.cpp midway-2.txt ** Rainfall Analysis Program ** Chicago Midway Airport_2000_2017 Average by year (inches): 2000: 3.42667 2001: 2 27022 (-) Average by month (inches): Jan: 1.97222 Feb: 1.81667 Mar: 2.56944 Apr: 3.96667 May: 4.78389 Jun: 3.855 Jul: 4.12056 In this project, how you solve the problem is just as important as getting the correct answers. Your program must meet the following requirements: 1. Your program must have at least 3 non-trivial functions. A "non-trivial" function has at least one parameter, and either contains a loop or performs some sort of computation requiring 5 or more lines of code. For example, a useful function in this program will be one that is given the month # (say 1..12 or 0..11) and returns the name of that month: string Month2String(int month) { if (month == 1) return "Jan"; else if... } This function will be useful when you need to output the month. An input function is also a common (and good) idea. 2. Your program must contain at least one array, either 1D or 2D, for storing / analyzing the data. For example, you could input and store all the data in a 2D array of size 200x13. Alternatively, notice the yearly averages could be computed as you input the data, so perhaps you store only the monthly sums in a 1D array, and then compute the averages after all the data has been input. 3. You may open the input file only once. You cannot repeatedly open and close the input file. 4. Commenting, spacing, indentation matters. Failure to meet any of these requirements may result in a grade of 0, even if you pass the test cases. If you look closely at the screenshot to the right, you'll notice that each yearly average is followed by a trend Running /home/ubuntu/workspace/project08/main.cpp midway-2.txt ** Rainfall Analysis Program ** Chicago Midway Airport_2000_2017 Average by year (inches): 2000: 3.42667 2001: 3.32833 (=) 2002: 2.75167 (-) 2003: 3.05333 (+) 2004: 2.975 (=) 2005: 2.06917 (-) 2006 3 9625 (++) If you look closely at the screenshot to the right, you'll notice that each yearly average is followed by a trend indicator: one of =, -, -, +, or ++. This is determined by comparing the year's average to the previous year: if -0.1 < difference < 0.1, the trend is = if -1.0 < difference
Step by Step Solution
3.59 Rating (149 Votes )
There are 3 Steps involved in it

Get step-by-step solutions from verified subject matter experts