

Question: The graph above refers to a significant decrease in input prices. Which of the following is likely to result? AS AS Price Level P2 P1
The graph above refers to a significant decrease in input prices. Which of the following is likely to result?
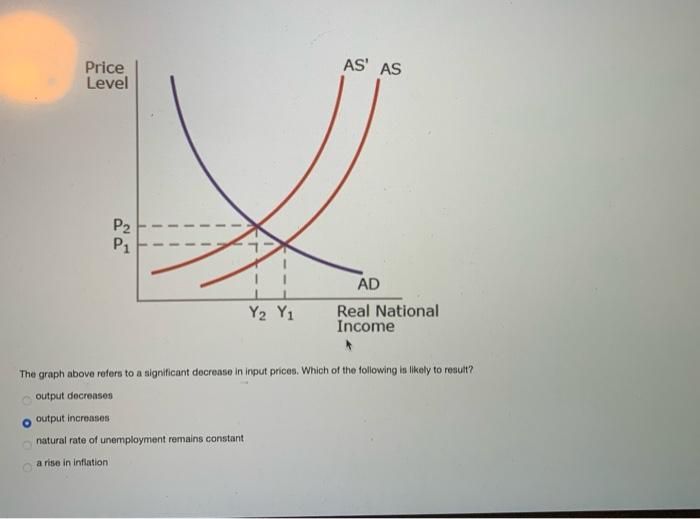
AS AS Price Level P2 P1 7 71 AD Real National Income The graph above refers to a significant decrease in input prices. Which of the following is likely to result? output decreases output increases natural rate of unemployment remains constant a rise in inflation
Step by Step Solution
There are 3 Steps involved in it
1 Expert Approved Answer
Step: 1 Unlock

Question Has Been Solved by an Expert!
Get step-by-step solutions from verified subject matter experts
Step: 2 Unlock
Step: 3 Unlock