

Question: The graph below called the 45 line diagram, which is sometimes known as the Keynesian cross diagram. Use the graph to describe the macroeconomic condition
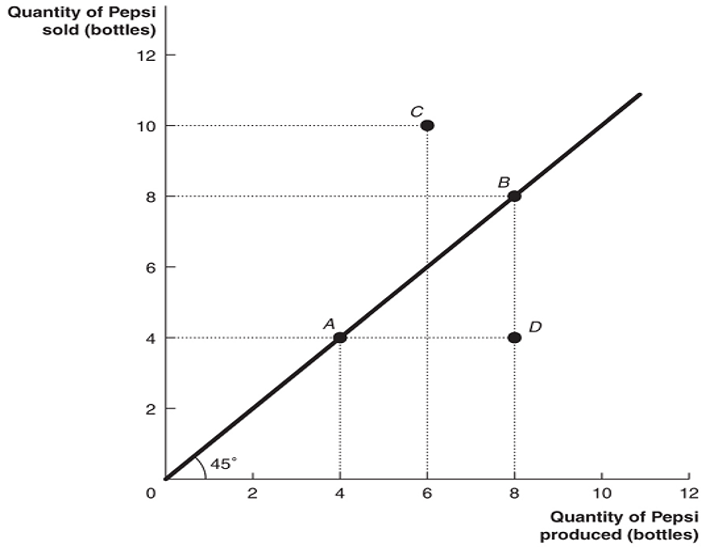
The graph below called the 45 line diagram, which is sometimes known as the Keynesian cross diagram. Use the graph to describe the macroeconomic condition characterising the economy shown. Assume the graph represent the Australian economy.
Figure 1


Step by Step Solution
There are 3 Steps involved in it
1 Expert Approved Answer
Step: 1 Unlock

Question Has Been Solved by an Expert!
Get step-by-step solutions from verified subject matter experts
Step: 2 Unlock
Step: 3 Unlock