

Question: The graph below depicts a government intervention setting at a price ceiling of $1,200 per month for a rental apartment. What is the value for

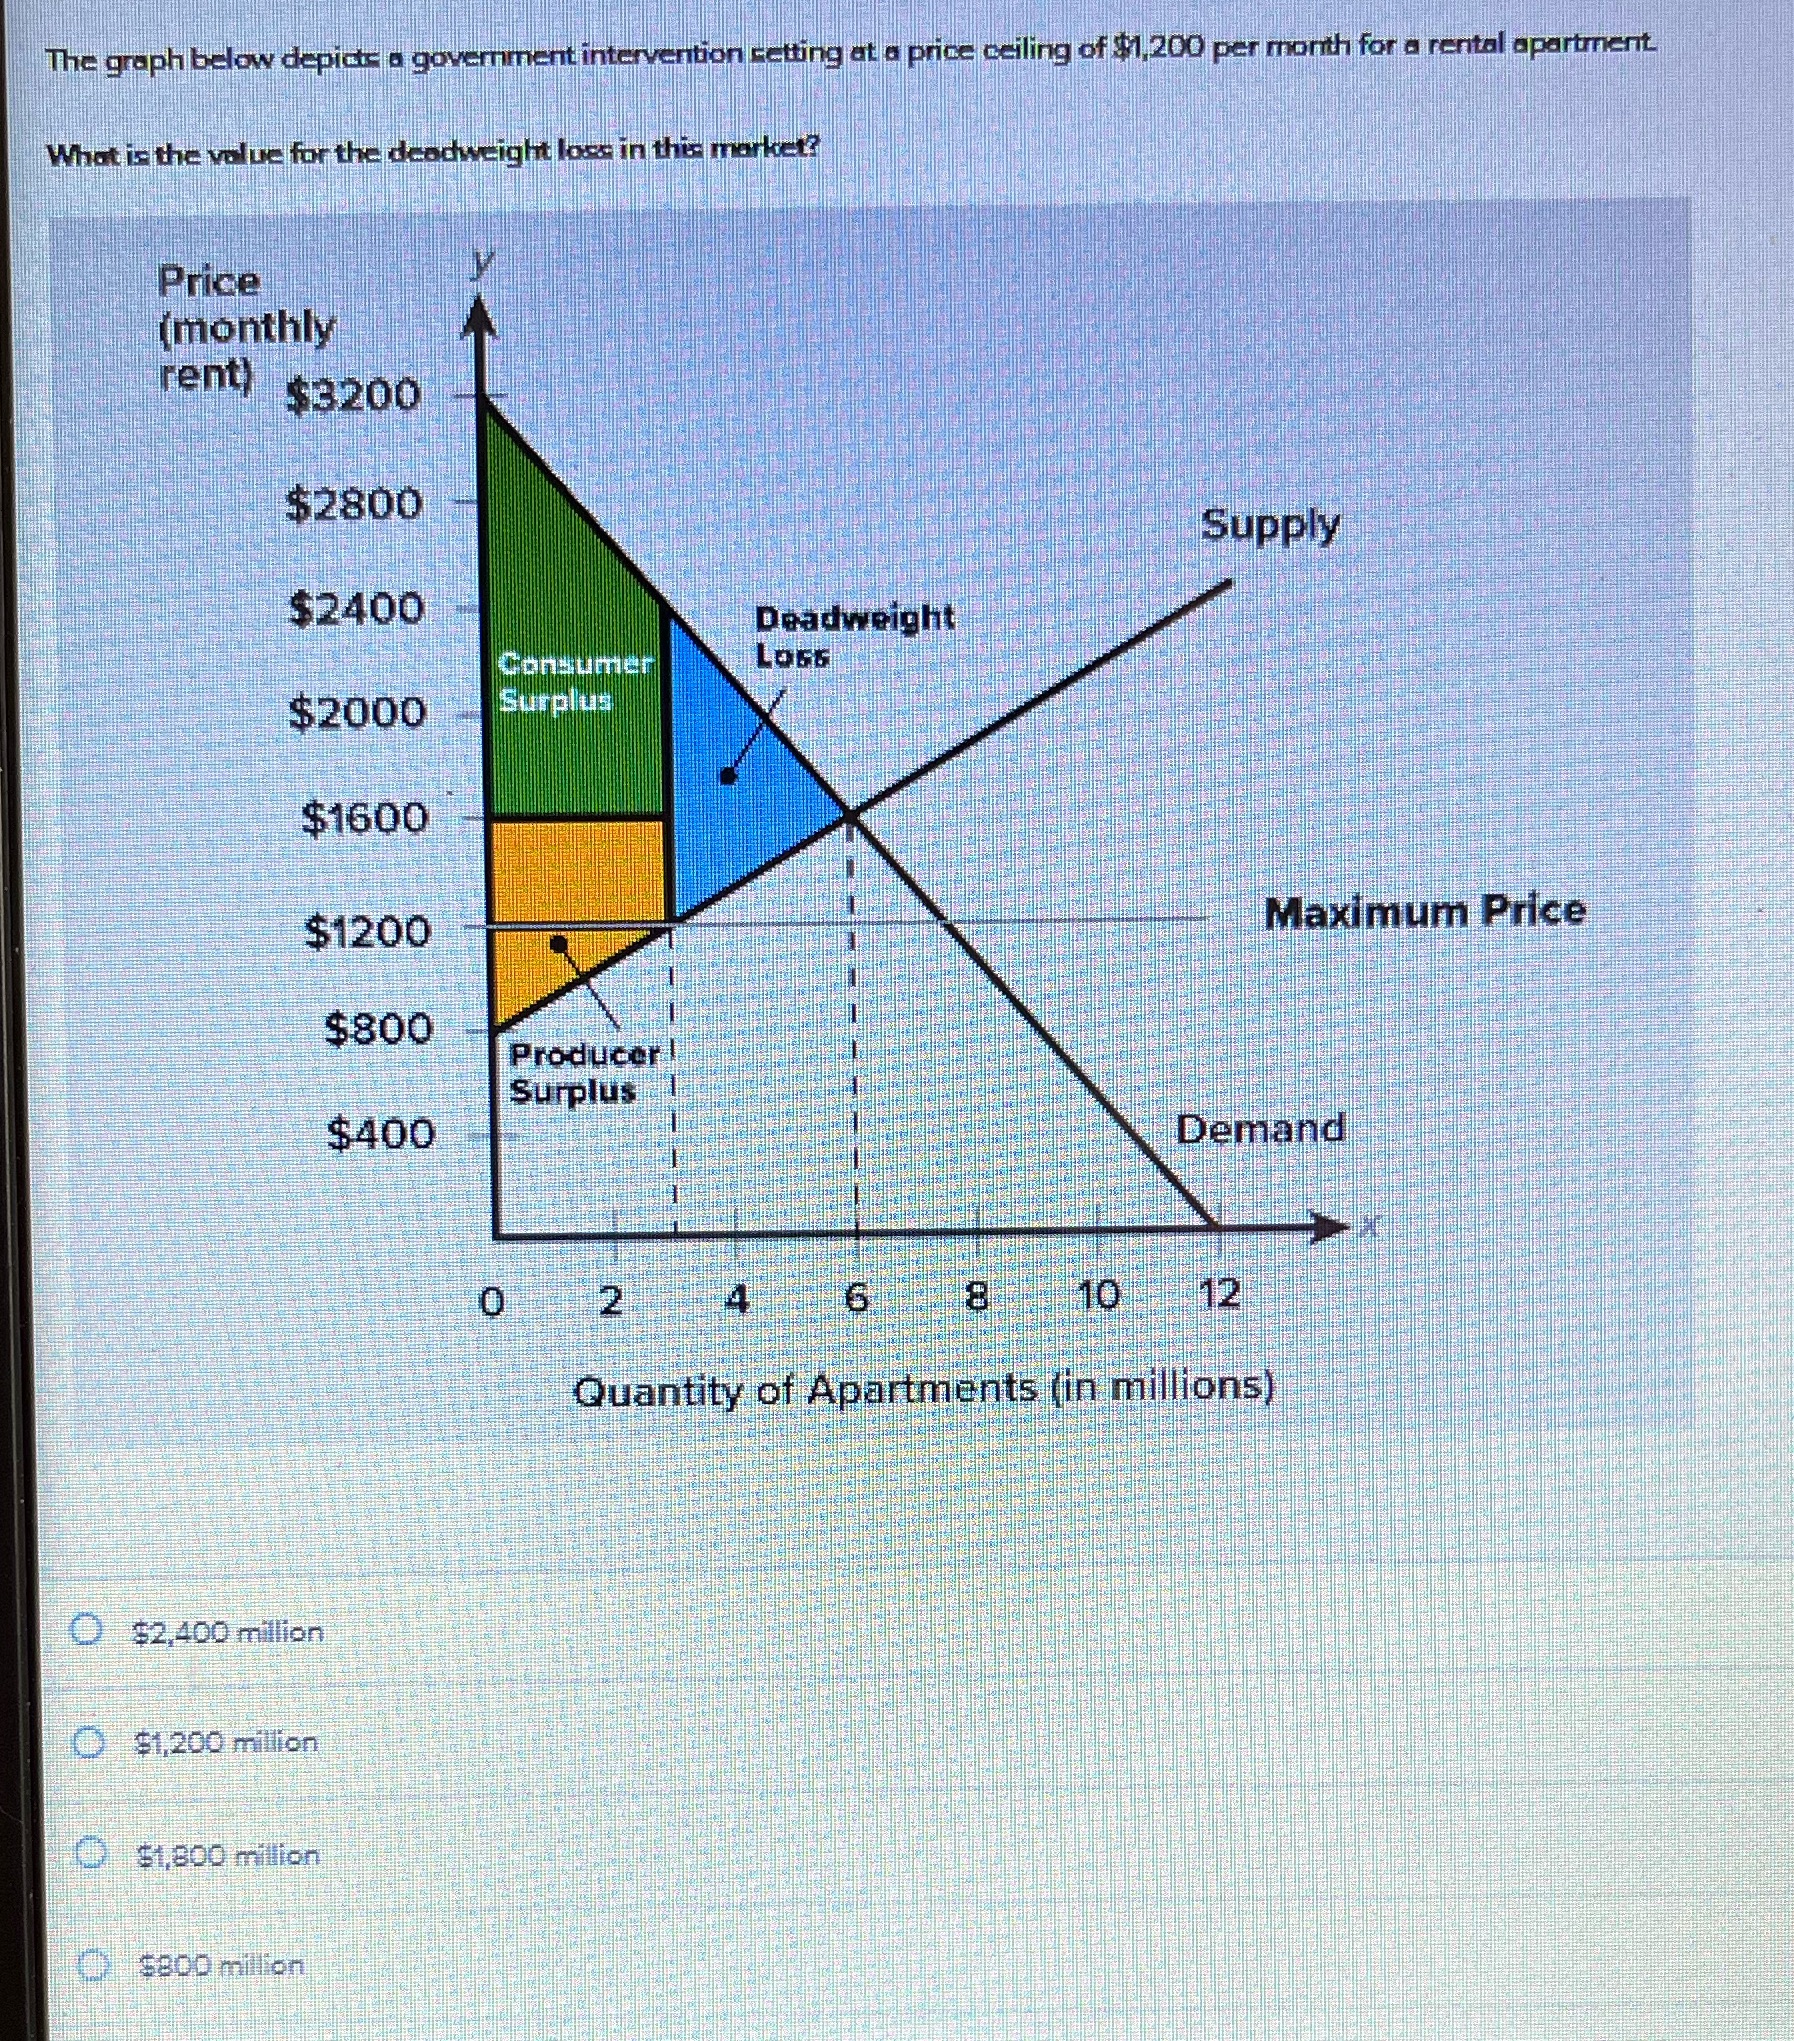
The graph below depicts a government intervention setting at a price ceiling of $1,200 per month for a rental apartment. What is the value for the deadweight loss in this market? Price [monthly rent) $3200 $2800 Supply $2400 Deadweight Consumer LOSE $2000 Surplus $1600 $1200 Maximum Price $800 Producer | Surplus $400 Demand O 6 8 10 12 Quantity of Apartments (in millions) $2,400 million $1,200 million $1,800 milion $800 million
Step by Step Solution
There are 3 Steps involved in it
1 Expert Approved Answer
Step: 1 Unlock

Question Has Been Solved by an Expert!
Get step-by-step solutions from verified subject matter experts
Step: 2 Unlock
Step: 3 Unlock