

Question: The graph below depicts the standard normal distribution with mean 0 and standard deviation 1. Find the indicated z-score. 0.7794 The indicated Z-score iS type


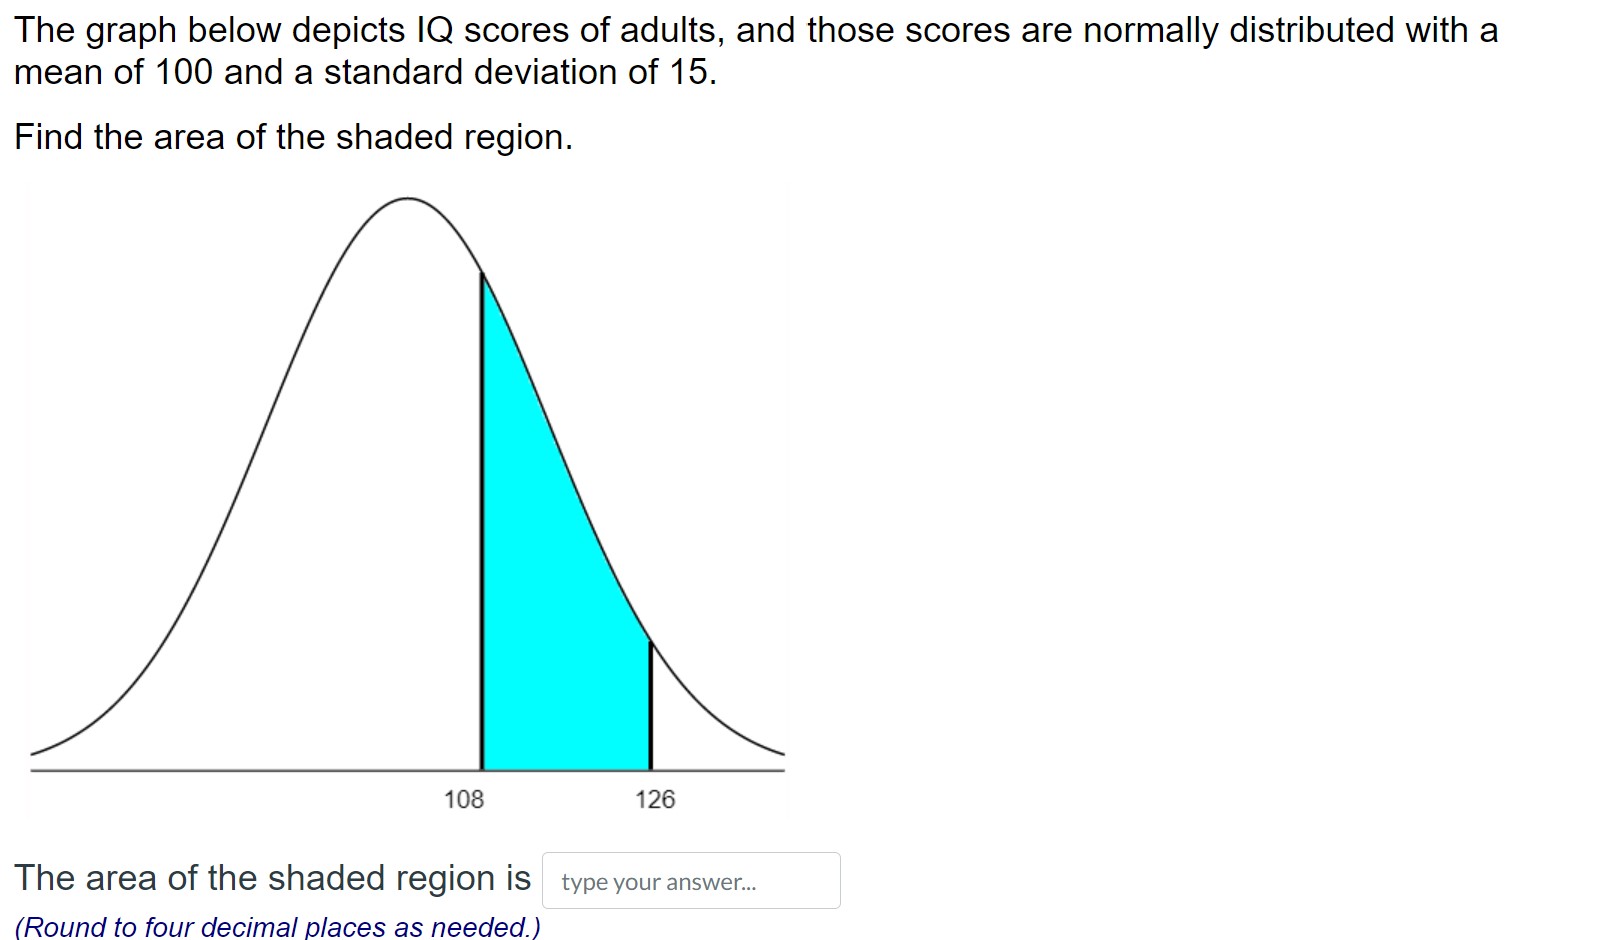

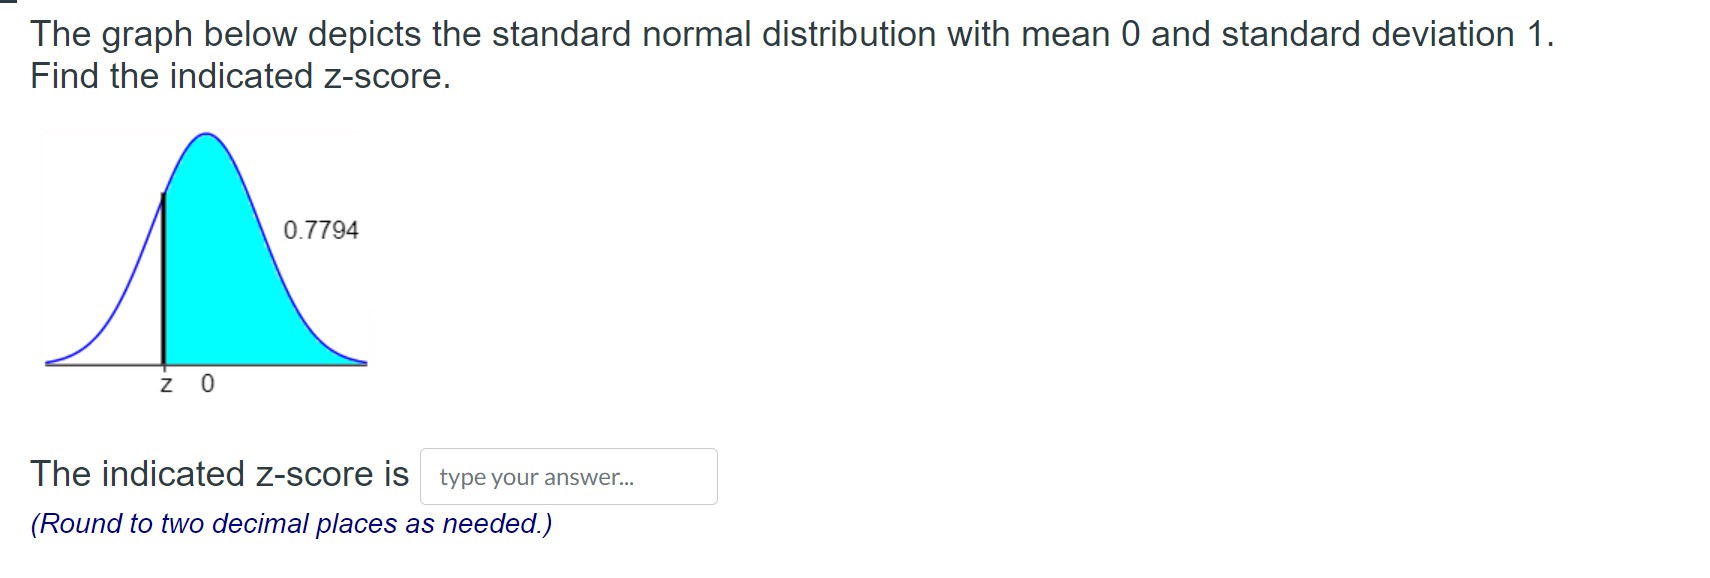
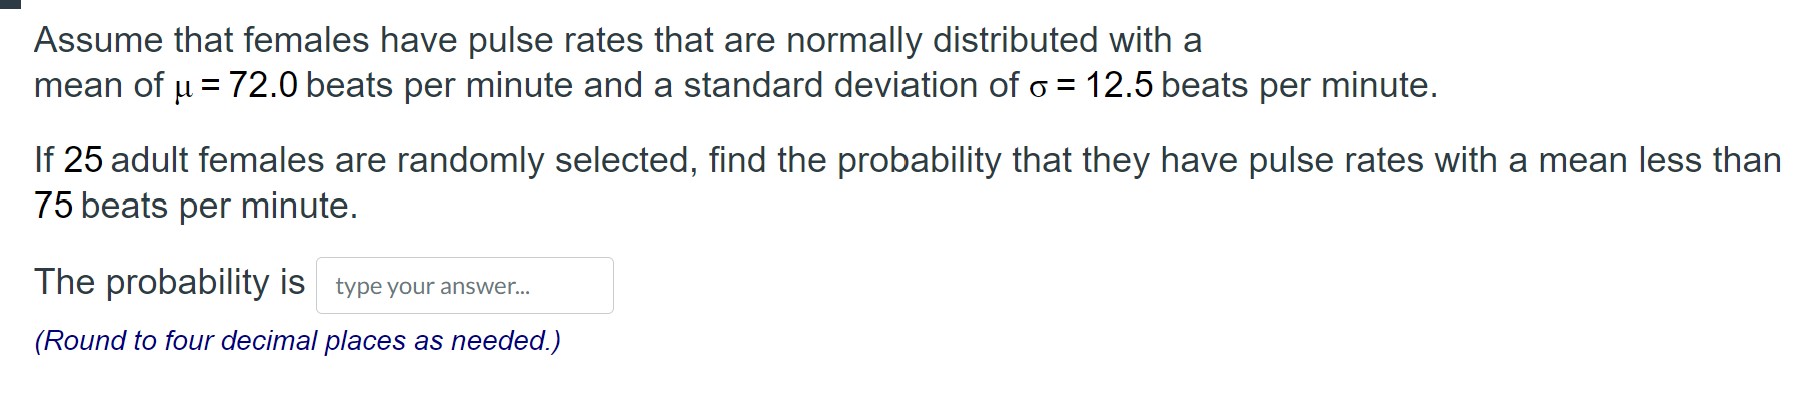


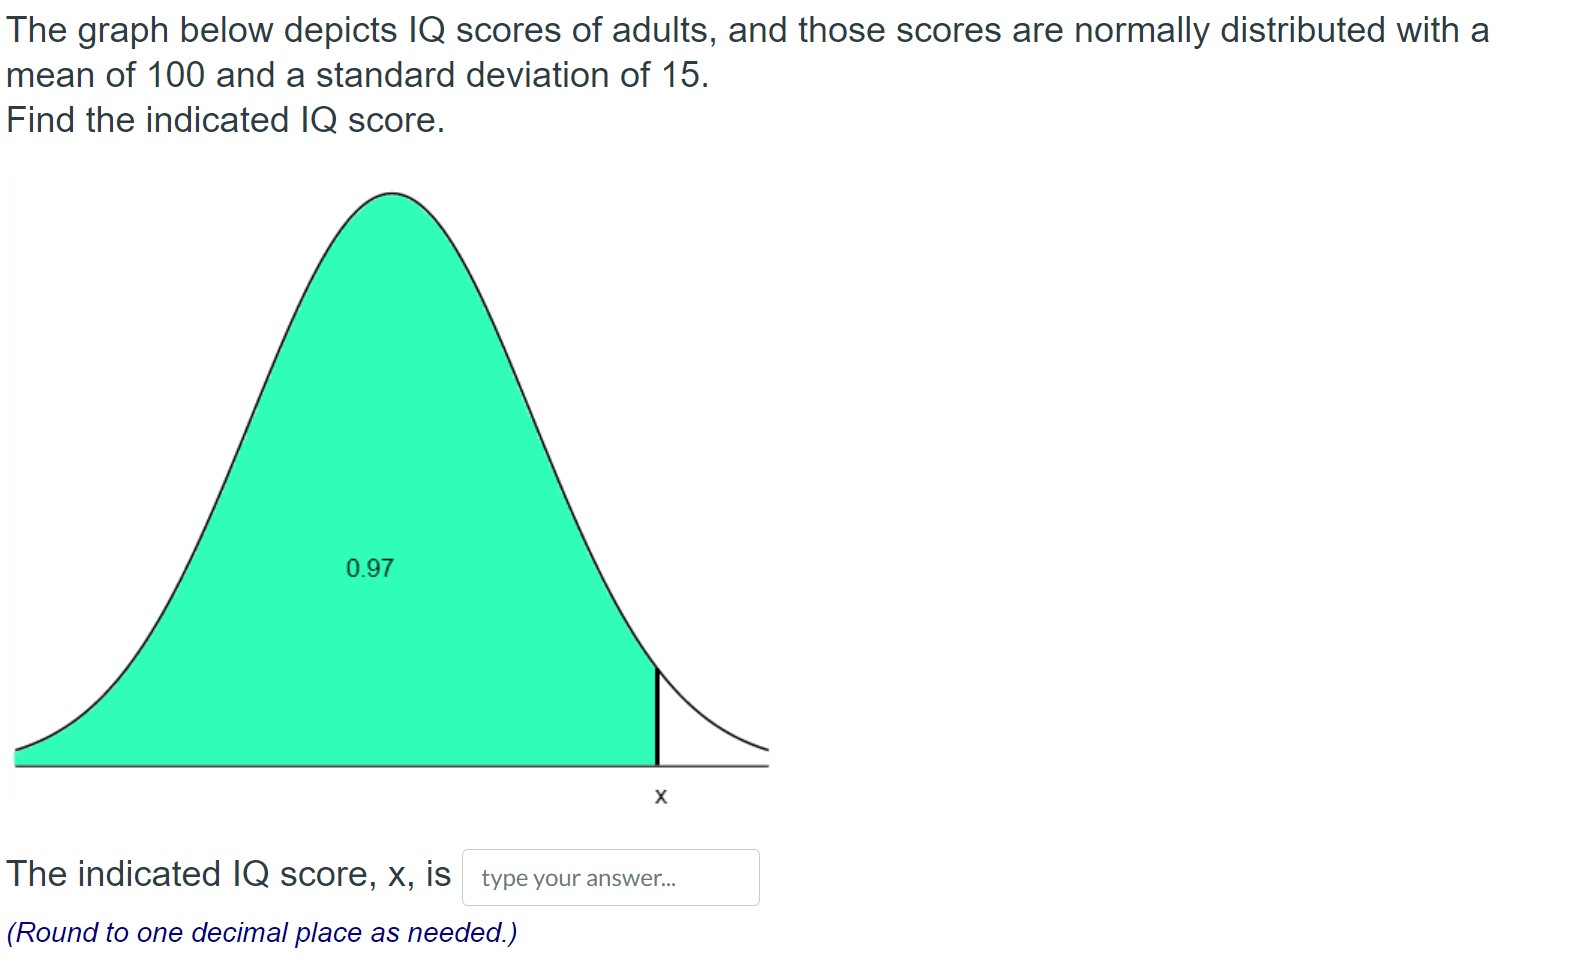
The graph below depicts the standard normal distribution with mean 0 and standard deviation 1. Find the indicated z-score. 0.7794 The indicated Z-score iS type your answer.\" (Round to two decimal places as needed.) Assume that females have pulse rates that are normally distributed with a mean of it = 72.0 beats per minute and a standard deviation of o = 12.5 beats per minute. If 25 adult females are randomly selected, find the probability that they have pulse rates with a mean less than 75 beats per minute. The probablllty is type your answer... (Round to four decimal places as needed.) Assume that adults have IQ scores that are normally distributed with a mean of H = 105 and a standard deviation 0 =15. Find the probability that a randomly selected adult has an IQ between 87 and 123. The probability is type your answer... (Round to four decimal places as needed.) The graph below depicts IQ scores of adults, and those scores are normally distributed with a mean of 100 and a standard deviation of 15. Find the area of the shaded region. 108 126 The area of the shaded region is type youranswer... (Round to four decimal places as needed.) A survey found that women's heights are normally distributed with mean 63.6 inches and standard deviation 2.5 inches. A branch of the military requires women's heights to be between 58 inches and 80 inches. Find the percentage of women meeting the height requirement. The percentage of women who meet the height requirement is 98.75 0/0 (Round to two decimal places as needed.) Assume that a randomly selected subject is given a bone density test. Those test scores are normally distributed with a mean of 0 and a standard deviation of 1. Find the probability that a given score is less than 1.99. The probability is type your answer.\" (Round to four decimal places as needed.) The graph below depicts IQ scores of adults, and those scores are normally distributed with a mean of 100 and a standard deviation of 15. Find the indicated IQ score. X The indicated IQ score, x, is typeyouranswer... (Round to one decimal place as needed.)
Step by Step Solution
There are 3 Steps involved in it

Get step-by-step solutions from verified subject matter experts