

Question: The graph below depicts two indifference curves for an individual consuming Good X and Good Y. Good X Good Y Compared to Bundle L. Bundle
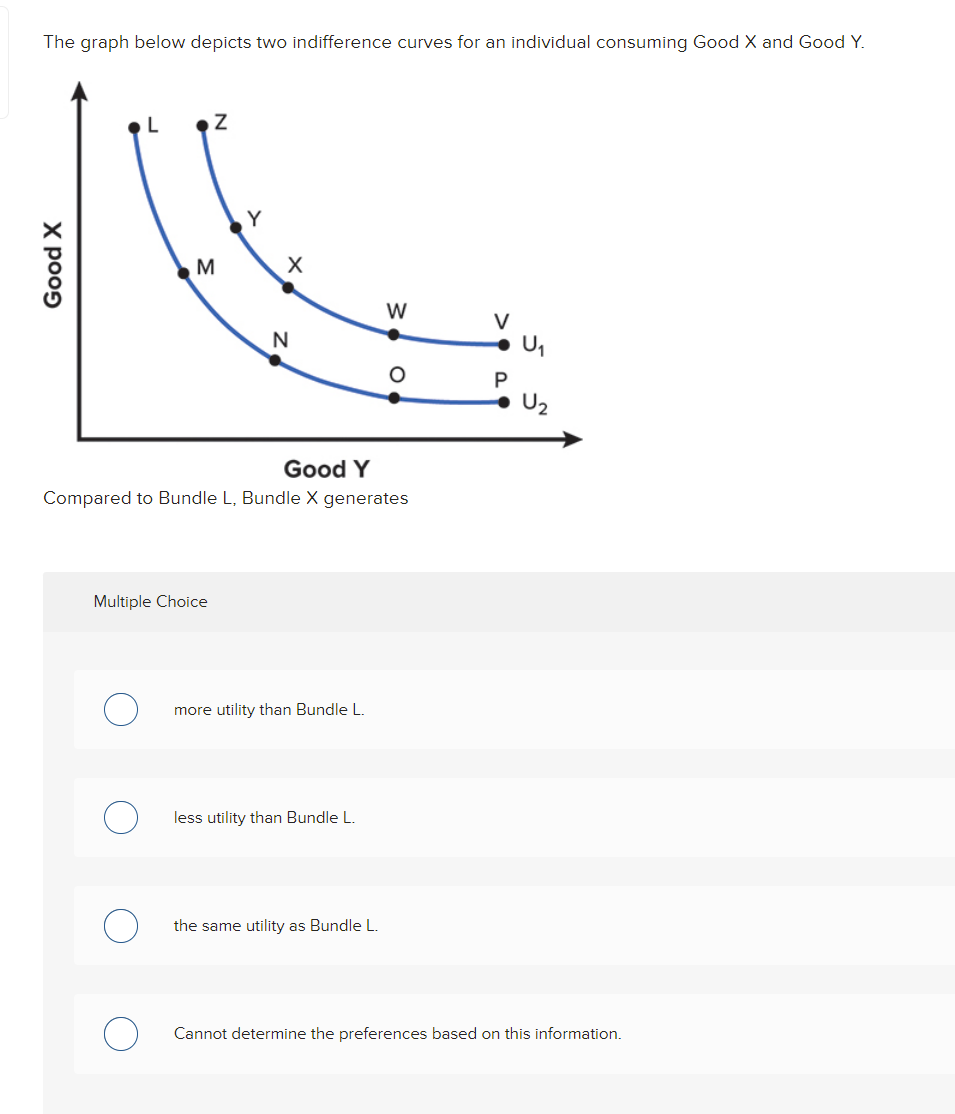

The graph below depicts two indifference curves for an individual consuming Good X and Good Y. Good X Good Y Compared to Bundle L. Bundle X generates Multiple Choice 0 more utility than Bundle L. 0 less utility than Bundle L. O the same utility as Bundle L. Q Can not determine the preferences based on this information
Step by Step Solution
There are 3 Steps involved in it
1 Expert Approved Answer
Step: 1 Unlock

Question Has Been Solved by an Expert!
Get step-by-step solutions from verified subject matter experts
Step: 2 Unlock
Step: 3 Unlock