

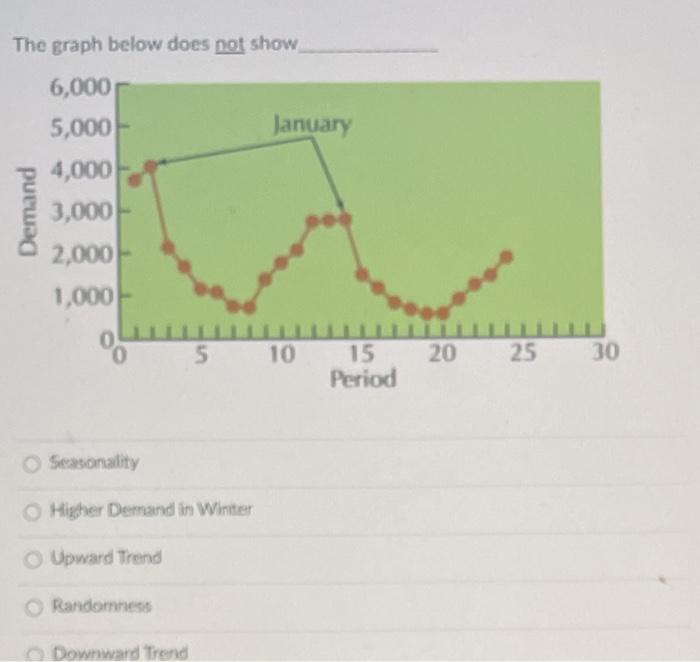
Question: The graph below does not show January Demand 6,000 5,000 4,000 3,000 2,000 1,000 0 5 10 20 25 30 15 Period Seasonality Higher Demand
Step by Step Solution
There are 3 Steps involved in it
1 Expert Approved Answer
Step: 1 Unlock

Question Has Been Solved by an Expert!
Get step-by-step solutions from verified subject matter experts
Step: 2 Unlock
Step: 3 Unlock