

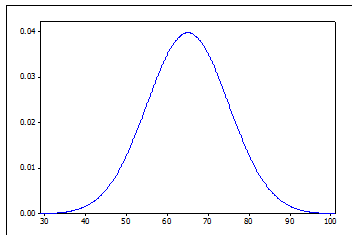
Question: The graph below illustrates the time students took to complete a test when all students were allowed to finish. The distribution has mean 65 minutes
The graph below illustrates the time students took to complete a test when all students were allowed to finish. The distribution has mean 65 minutes and standard deviation 10 minutes. If the instructor wants to set a time limit such that 95% of students should be able to finish, how many minutes should be allowed? Answer to one decimal place.
\f
Step by Step Solution
There are 3 Steps involved in it
1 Expert Approved Answer
Step: 1 Unlock

Question Has Been Solved by an Expert!
Get step-by-step solutions from verified subject matter experts
Step: 2 Unlock
Step: 3 Unlock