

The graph below indicates the EBIT of three operating activities (referring to three currencies) for a companys
Question:
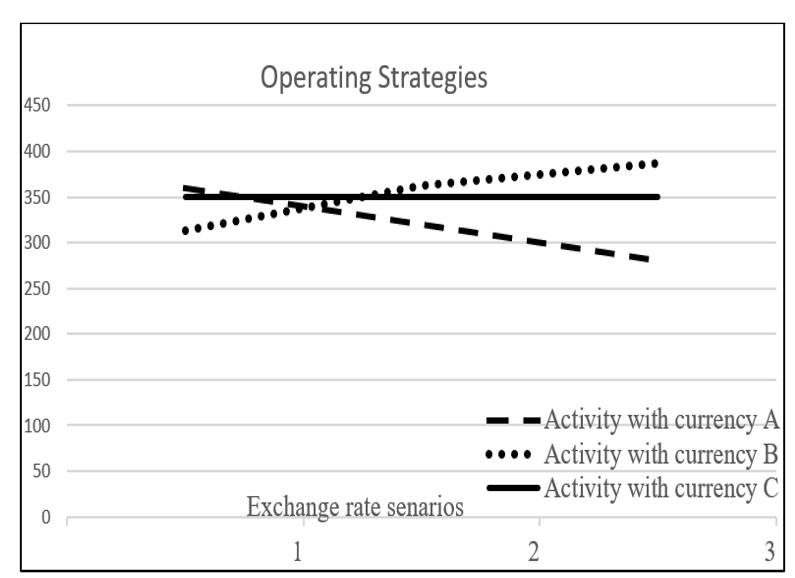
The graph below indicates the EBIT of three operating activities (referring to three currencies) for a company’s operations, considering the exchange rate scenarios available. Each scenario reflects increase in the value of the foreign currency compared to the home currency. For each of the three operating activities
1.discuss the relation between EBIT and exchange rate movements,
2.Which of the three current operating activities is less risky and why?
3.suggest how the company can achieve internal hedging in order to reduce its economic exposure (if any).
4.Explain economic exposure and discuss the empirical evidence arguing in favour of, and against, hedging economic exposure.
5.Discuss the challenges of hedging operating vs transaction FX exposure.
Expert Answer:
1 Discuss the relation between EBIT and exchange rate movements The relation between EBIT and exchan... View the full answer


Introductory Financial Accounting for Business
ISBN: 978-1260299441
1st edition
Authors: Thomas Edmonds, Christopher Edmonds
