

Question: The graph below is a residual plot from this simple linear regression analysis. What's the problem indicated by the plot? Diagnostic Plot 0.98 0.9 0.8
The graph below is a residual plot from this simple linear regression analysis. What's the problem indicated by the plot?
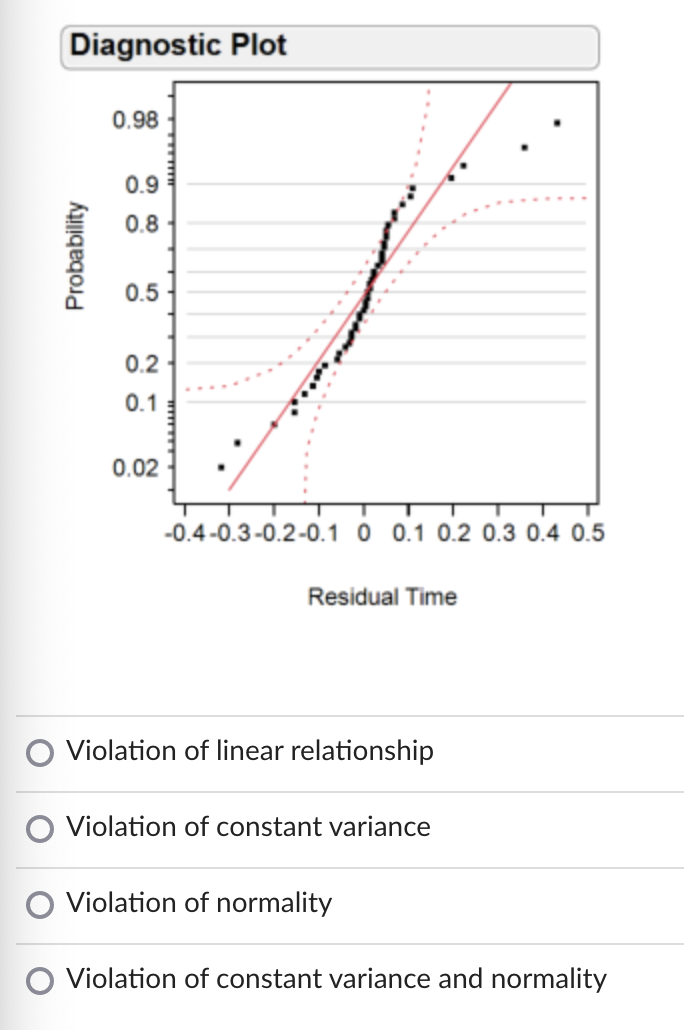
Diagnostic Plot 0.98 0.9 0.8 Probability 0.5 0.2 0.1 0.02 -0.4-0.3-0.2-0.1 0 0.1 0.2 0.3 0.4 0.5 Residual Time O Violation of linear relationship O Violation of constant variance O Violation of normality O Violation of constant variance and normality
Step by Step Solution
There are 3 Steps involved in it
1 Expert Approved Answer
Step: 1 Unlock

Question Has Been Solved by an Expert!
Get step-by-step solutions from verified subject matter experts
Step: 2 Unlock
Step: 3 Unlock