

Question: The graph below is attempting to communicate the relationship between two variables: age lizards in months [z-scored, on the x-axis) and the number of mealworms
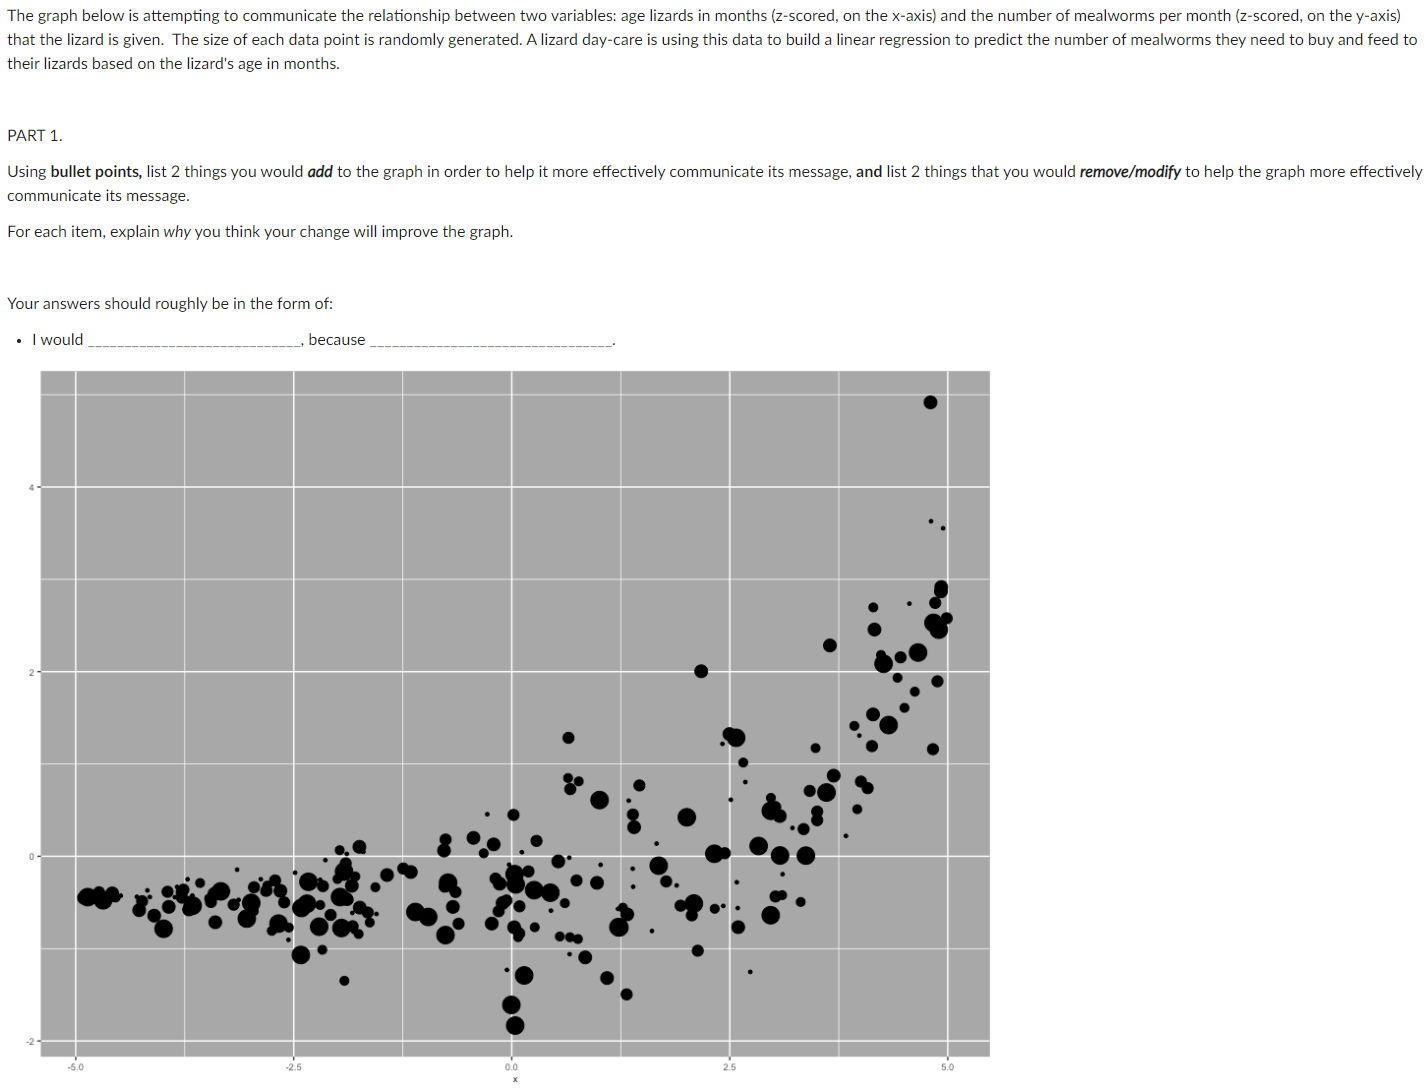

The graph below is attempting to communicate the relationship between two variables: age lizards in months [z-scored, on the x-axis) and the number of mealworms per month (2-scored, on the y-axis} that the lizard is given. The size of each data point is randomly generated. A lizard day-care is using this data to build a linear regression to predict the number of mealworms they need to buy and feed to their lizards based on the lizard's age in months. PART 1. Using bullet points, list 2 things you would add to the graph in order to help it more effectively communicate its message, and list 2 things that you would remavelmadify to help the graph more effectively communicate its message. For each item, explain why you think your change will improve the graph Your answers should roughly be in the form of: - lwould 7777777777777777777777777 , because 77777777777777777777777777777
Step by Step Solution
There are 3 Steps involved in it

Get step-by-step solutions from verified subject matter experts