

Question: The graph below is based on a unit selling price of $5.50 and a variable cost of $3.25 per unit. Fixed costs are $18,000. 90,000
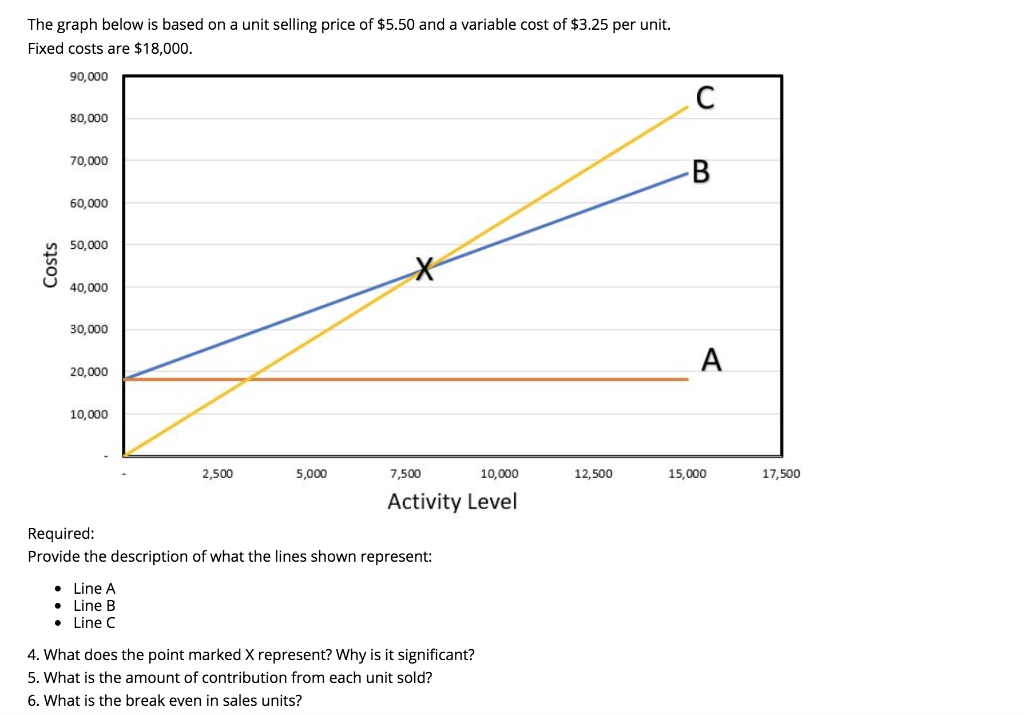
The graph below is based on a unit selling price of $5.50 and a variable cost of $3.25 per unit. Fixed costs are $18,000. 90,000 C 80,000 70,000 B 60,000 50,000 Costs X 40,000 30,000 A 20,000 10,000 12,500 15,000 17,500 2,500 5,000 7,500 10,000 Activity Level Required: Provide the description of what the lines shown represent: Line A Line B Line C 4. What does the point marked X represent? Why is it significant? 5. What is the amount of contribution from each unit sold? 6. What is the break even in sales units
Step by Step Solution
There are 3 Steps involved in it
1 Expert Approved Answer
Step: 1 Unlock

Question Has Been Solved by an Expert!
Get step-by-step solutions from verified subject matter experts
Step: 2 Unlock
Step: 3 Unlock