

Question: The graph below is based on a unit selling price of $6.00 and a variable cost of $3.95 per unit. Fixed costs are $14,000. Cost
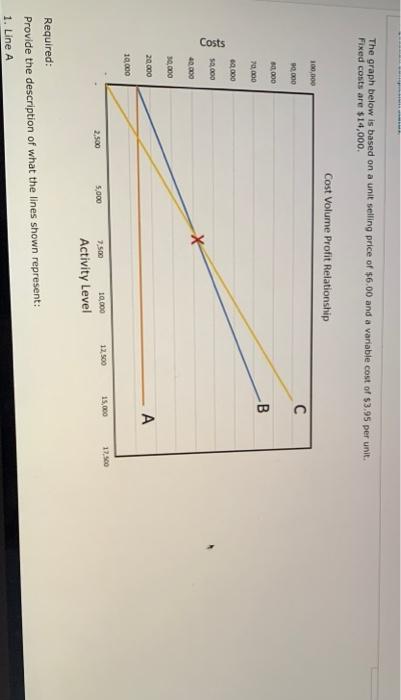
The graph below is based on a unit selling price of $6.00 and a variable cost of $3.95 per unit. Fixed costs are $14,000. Cost Volume Profit Relationship 100,000 90,000 30.000 B 70,000 0.000 Costs 50.000 X 40.000 30.000 20.000 A 10.000 12.500 15,000 10,000 17.500 2.500 7.500 5,000 Activity Level Required: Provide the description of what the lines shown represent: 1. Line A Required: Provide the description of what the lines shown represent: 1. Line A 2. Line B 3. Line C 4. What does the point marked X represent? Why is it significant? 5. What is the amount of contribution from each unit sold? Show your work. 6. What is the break even in sales units? Show the formula used
Step by Step Solution
There are 3 Steps involved in it

Get step-by-step solutions from verified subject matter experts